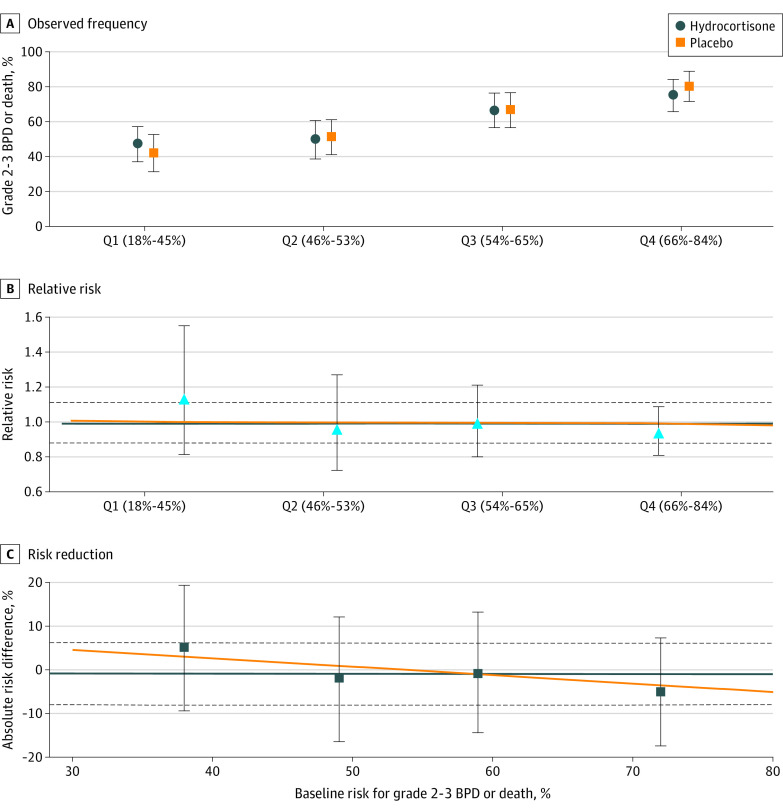
Figure 1. Efficacy Outcome.
The observed frequency (A), relative risk (B), and risk reduction (C) of grades 2 to 3 bronchopulmonary dysplasia (BPD) or death in the hydrocortisone vs placebo treatment groups are shown by quartile (Q) of baseline estimated risk of grades 2 to 3 BPD or death. Symbols (circles, squares, and triangles) represent estimated values by quartile of baseline risk; error bars indicate 95% CIs. The horizontal orange lines indicate the model estimated results; the horizontal blue lines and dashed lines indicate the overall trial result and 95% CIs, respectively. Grades 2 to 3 BPD or death did not differ by interaction between treatment group and baseline risk for grades 2 to 3 BPD or death.

