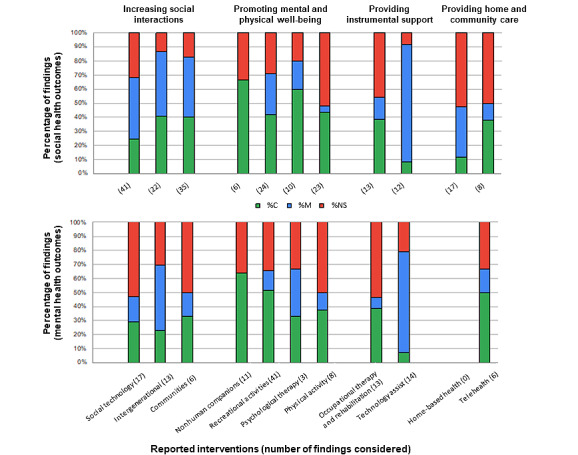
Figure 3.

Percentage of findings related to social (top part of figure) and mental health (bottom part of figure) outcomes for each of the 11 intervention subcategories evaluated as either consistent (C; green), mixed (M; blue), or not supporting (NS; red) effectiveness (numbers in the parentheses represent the number of findings considered to calculate the effectiveness of each type of intervention).
