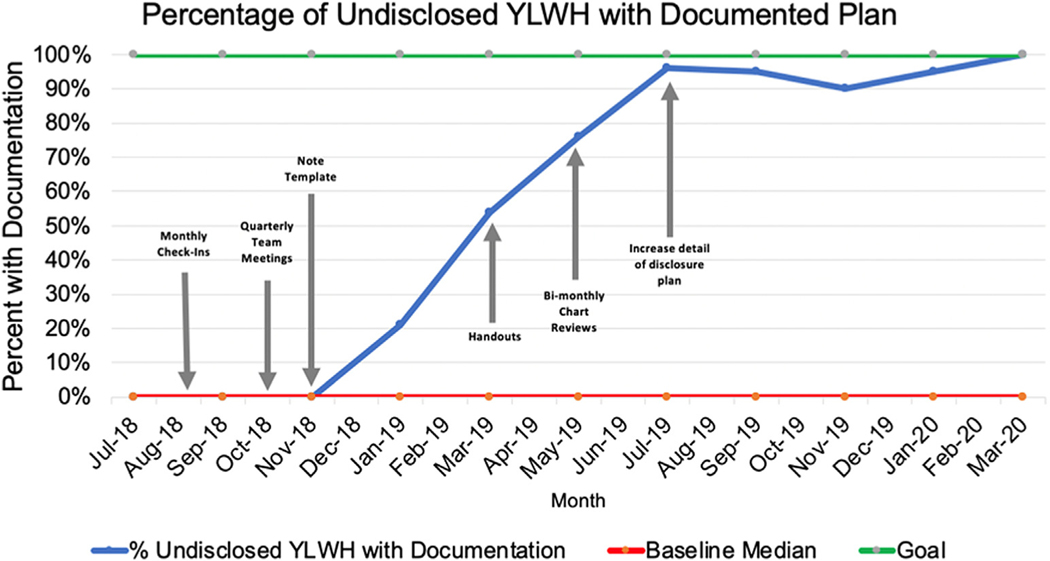
Figure 4.
The blue line represents the percentage of undisclosed YLWH of all ages with documentation of their HIV status at the time represented on the horizontal axis, the red line represents the baseline percentage of undisclosed YLWH with documented status before the initiation of the project (0%), and the green line represents the goal percentage of undisclosed YLWH to have a documented status (100%). Gray arrows indicate the interventions/PDSA cycles.

