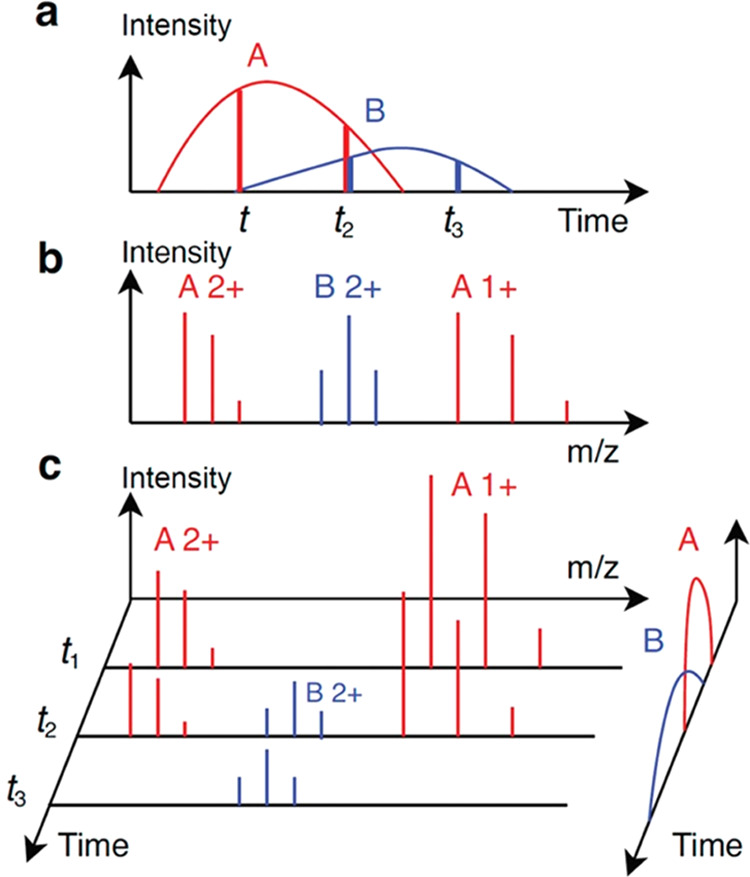
Figure 1.

Illustration of two proteoform features in an LC-MS map. (a) Elution profiles (curves) of two proteoforms A and B. At time points t1, t2, and t3, three MS1 spectra are generated. The abundances of A have a ratio of 4:3:0 (two red vertical lines), and the abundances of B have a ratio of 0:1:1 (two blue vertical lines). (b) Theoretical isotopic envelopes of proteoform A with charge states 1+ and 2+ and proteoform B with charge state 2+. (c) Three MS1 spectra are generated at time points t1, t2, and t3. The elution profiles on the right are the same as (a). The three spectra contain four experimental isotopic envelopes of A and two envelopes of B.
