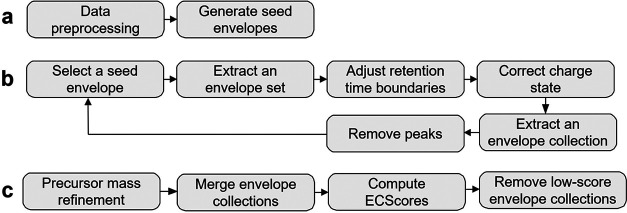
Figure 2.
Overview of the pipeline for proteoform feature identification in TopFD. (a) Preprocessing. Experimental centroided peaks are processed to remove those that have a low intensity or appear in only one MS1 spectrum. Then, MS-Deconv is used to deconvolute MS1 spectra to obtain seed envelopes. (b) Proteoform feature extraction. (1) The reported seed envelopes are ranked based on the sum of the peak intensities of the theoretical envelope. The one with the highest intensity is selected. (2) To extract an envelope set, peaks in the seed theoretical envelope are matched with experimental peaks and extended in both forward and backward directions until no matching experimental peaks are found. (3) The RT boundaries of the reported envelope set are refined if it contains peaks from neighboring envelope sets. (4) The charge state of the envelope set is evaluated and corrected if needed. (5) Once an envelope set is extracted, the neighboring charge states are explored to find other envelope sets in the envelope collection. (6) The experimental peaks included in the envelope collection are removed from the data. The six steps are repeated for the next seed envelope, which has the highest intensity in the remaining seed list. (c) Postprocessing. The precursor masses of reported envelope collections are first refined. Envelope collections are then merged if they have similar precursor masses and similar retention time ranges. Finally, an ECScore is computed for each envelope collection and those with low ECScore are removed.

