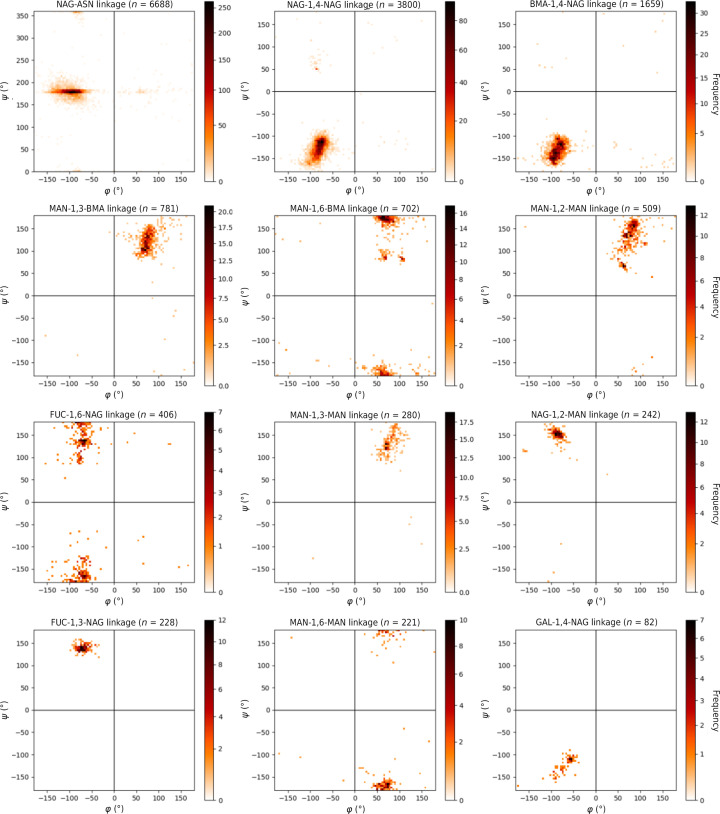
Figure 3.
Plots of φ and ψ values for all linkages collected with over 50 data points. Colour bars are plotted using the power-law distribution (Clauset et al., 2009 ▸) to highlight outliers visually. Plots allow visualization of the energy-minima values.

