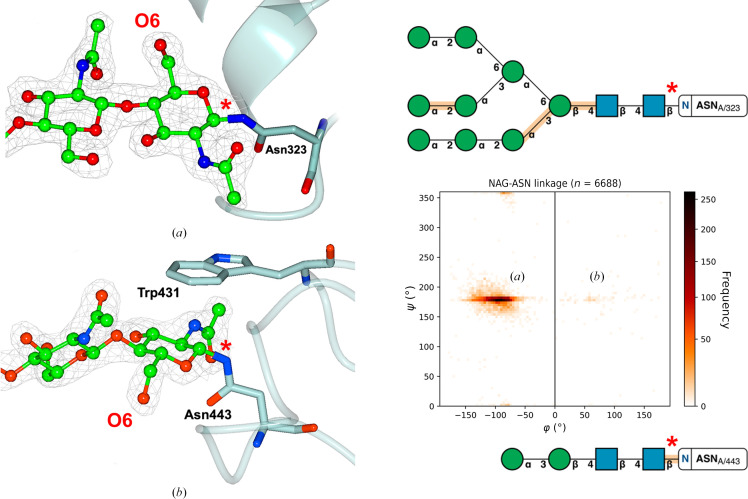
Figure 4.
Two main conformations for the NAG-ASN bond are detected in our data set, as previously shown in the literature (Imberty & Perez, 1995 ▸). (a) shows the most frequent conformation (see the graph on the right for an idea of the numbers), with (b) showing a secondary and much more infrequent preference. In (b) the GlcNAc appears flipped with respect to the orientation it has in (a); this can be spotted easily by looking at O6 of GlcNAc (annotated in the figure), which appears on opposite sides of the asparagine side chain. Both shown conformations are from PDB entry 5fji (Agirre et al., 2016 ▸); 2mF o − DF c electron density is shown at 1σ for the glycans, but is omitted for the asparagine side chains for reasons of clarity; the positions of the asparagine side chains showed a good fit to the electron density.

