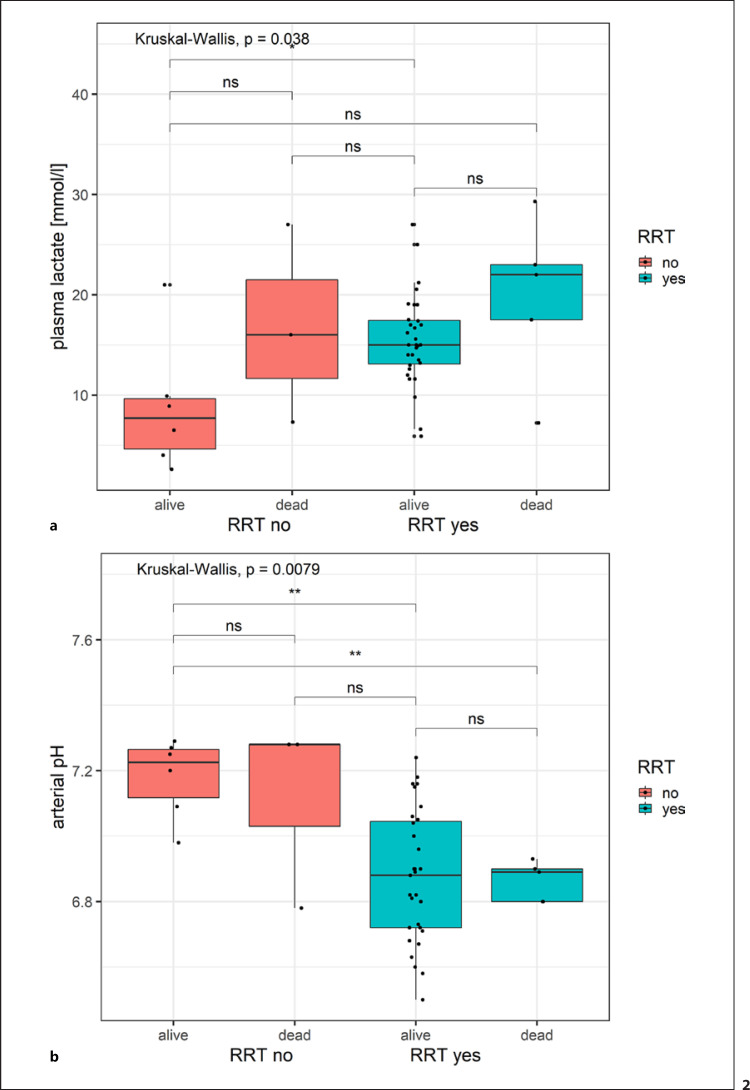
Fig. 2.
Boxplot of lactate and arterial pH stratified by RRT and mortality. Boxplot of lactate levels (a) and arterial pH (b), stratified by patients with and without RRT and clinical outcomes (survivors/non-survivors). Overall differences in group means is indicated by Kruskal-Wallis test statistics. Significance levels of difference for pairwise group comparisons are indicated with stars (**: 0.001 < p < 0.01; *: 0.01 < p < 0.05, ns: p < 0.05).

