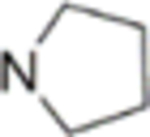
Table 2.
The TOP1 and TDP1 Inhibitory Potency, and Cytotoxicity of 33–45.

| ||||||
|---|---|---|---|---|---|---|
|
| ||||||
| GI50 ± SD (μM)[c] |
||||||
| Cpd | n | R | TOP1 Inhibition[a] |
IC50 (μM) for TDP1[b] |
HCT-116 | MCF-7 |
| 4 | /d | / | 0/+ | >111 | 75 ± 4.4 | >100 |
| 33 | 0 | H | + | >111 | >100 | >100 |
| 34 | 2 | NMe2 | + | 37–111 | 11 ± 0.48 | 27 ± 1.5 |
| 35 | 3 | 0 | 18 ± 6.9 | 0.55 ± 0.17 | 1.2 ± 0.10 | |
| 36 | 2 | NEt2 | 0 | >111 | 2.1 ± 0.23 | 1.6 ± 0.17 |
| 37 | 3 | + | 15 ± 2.4 | 2.4 ± 0.11 | 2.0 ± 0.10 | |
| 38 | 2 |

|
+++ | 37–111 | 0.25 ± 0.02 | 6.4 ± 1.0 |
| 39 | 3 | + | 15 ± 2.8 | 1.3 ± 0.21 | 1.4 ± 0.13 | |
| 40 | 2 |

|
++ | >111 | 15 ± 1.08 | 18 ± 0.67 |
| 41 | 3 | + | >111 | 3.3 ± 0.73 | 7.9 ± 1.0 | |
| 42 | 3 | OH | + | >111 | 38 ± 2.31 | 51 ± 1.6 |
| 43 | 3 | NH(CH2)2OH | + | 10 ± 3.8 | 0.29 ± 0.19 | 2.2 ± 1.2 |
| 44 | 3 |

|
0/+ | >111 | 10 ± 1.2 | 7.0 ± 0.55 |
| 45 | 3 |

|
0 | >111 | >100 | 85 ± 3.8 |
TOP1 cleavage inhibitory activity of the compounds was semiquantitatively expressed relative to CPT at 1 μM as follows: 0, no inhibition; 0/+, less than 20%; +, between 20% and 50% activity; ++, between 50% and 75% activity; +++, between 75% and 95% activity.
IC50 values for TDP1 inhibition, defined as the concentration of compound that inhibits 50% of enzyme activity, were detected through the gel-based assays.
The cytotoxicity GI50 value was defined as the concentration corresponding to 50% cell growth inhibition and obtained from MTT assay. Every experiment was repeated at least three times independently.
“/” means “inapplicable”.
