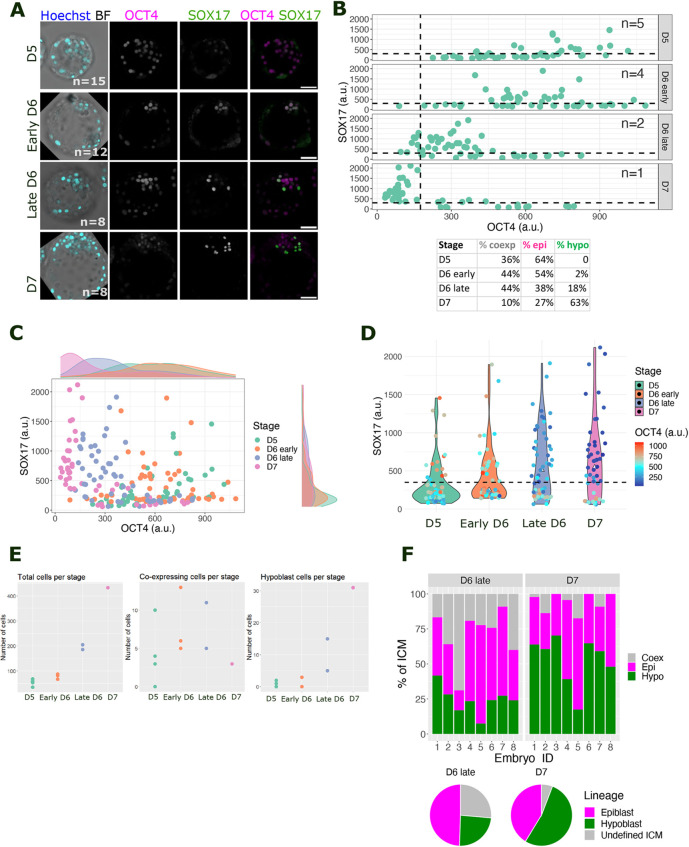
Fig. 1.
Tracing the appearance of hypoblast in human blastocysts from D5 to D7. (A) Representative confocal images of human blastocysts at day (D) 5, early D6, late D6 and D7, immunostained for OCT4 (epiblast, magenta) and SOX17 (hypoblast, green) from z-stack combinations of nine consecutive 1 µm single images. n indicates the number of embryos analysed per stage. Scale bars: 50 µm. (B) Scatter plots quantifying nuclear intensity of OCT4 (x-axis) and SOX17 (y-axis) in the ICM. Each dot corresponds to one cell. Dashed lines represent the intensity level/expression threshold calculated at D7, after the TE, epiblast and hypoblast had segregated. a.u., arbitrary units. Table below indicates the percentage of cells belonging to each lineage at the different stages. (C) Scatter plot combining nuclear intensity data from ICM cells at different stages. Marginal density plots showing distribution of data into discrete populations or heterogeneous levels. (D) Violin plot comparing nuclear fluorescence intensity of SOX17 across stages and its co-expression with nuclear OCT4. The dashed line represents the expression threshold for SOX17 calculated at D7. (E) Swarm plot for the absolute number of total cells, OCT4 and SOX17 co-expressing cells, and hypoblast cells per stage. (F) Top panel: stacked bar plot quantifying the percentage of each lineage in individual ICMs at late D6 and D7. Lower panel: pie charts showing the average percentage of each lineage in each stage.

