Fig. 2.
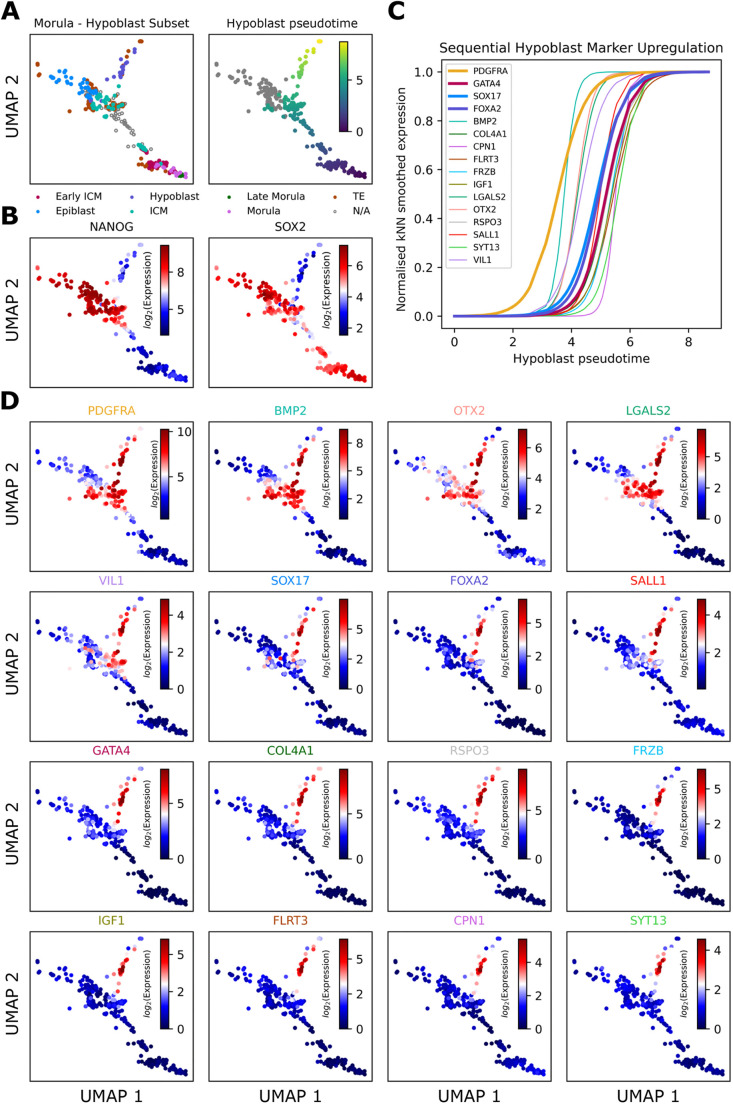
Pseudotime analysis of published scRNA-seq data from human embryos to establish the order of appearance of hypoblast markers. (A) Human preimplantation embryo UMAP embedding (Radley et al., 2022) sub-setted down to samples involved during bifurcation to epiblast/hypoblast populations. Left panel: cell type labels defined by Stirparo et al. (2018). Right panel: pseudotime along the hypoblast branch. (B) NANOG and SOX2 distinguish hypoblast and epiblast populations. kNN, k-nearest neighbours. (C) Fitting a logistic curve to the smoothed gene expression against hypoblast pseudotime delineates hypoblast gene activation. (D) Overlays of smoothed gene expression onto UMAP confirms ordered upregulation specific to the hypoblast.

