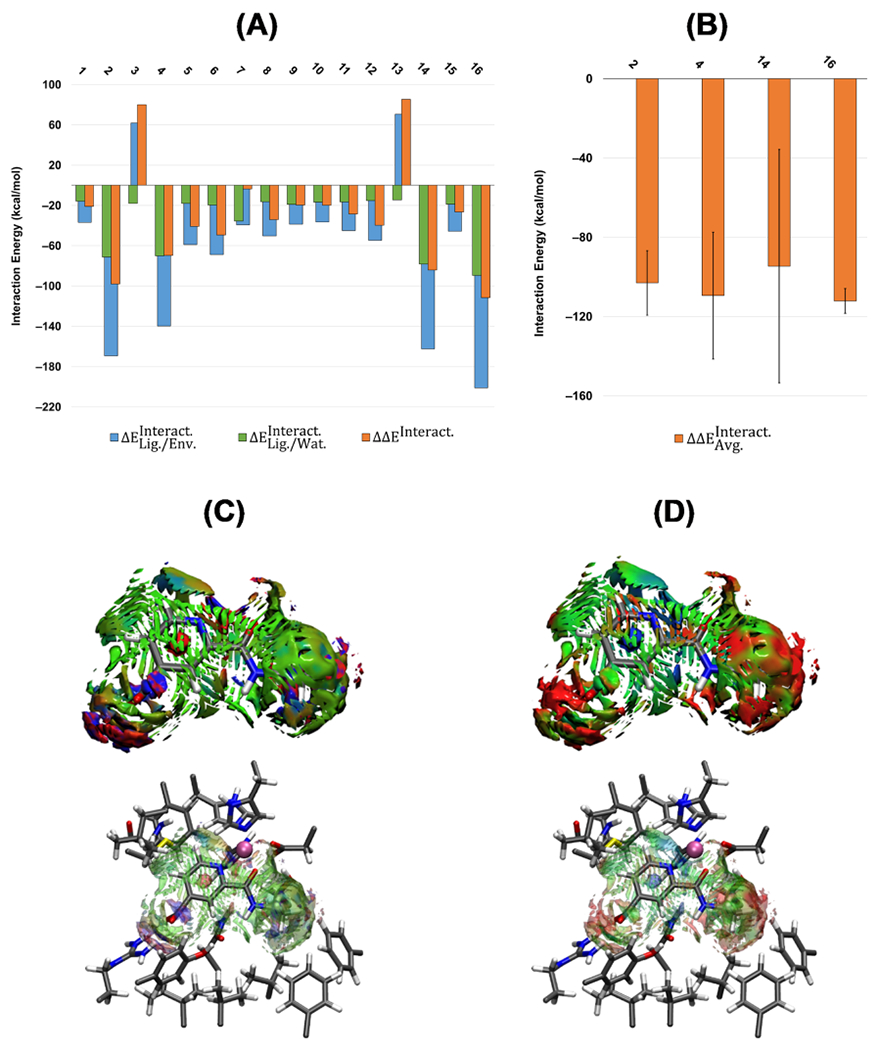
Figure 2.

(A) Calculated QM/MM interaction energies (kcal mol−1) for the first set of test compounds (ID: 1–16). (B) Average QM/MM interaction energies () and the standard deviation for the compounds with the most negative interaction energies. All of the calculations are at the ωB97X-D/6-31G(d,p) level of theory and AMOEBAbio18 force field. (C) Averaged noncovalent index (aNCI) and (D) thermal fluctuation index (TFI) analyses for cpd12 (ID: 14). The isosurface cutoff for NCI and TFI is 0.4 au, and the data is plotted in the color range of .
