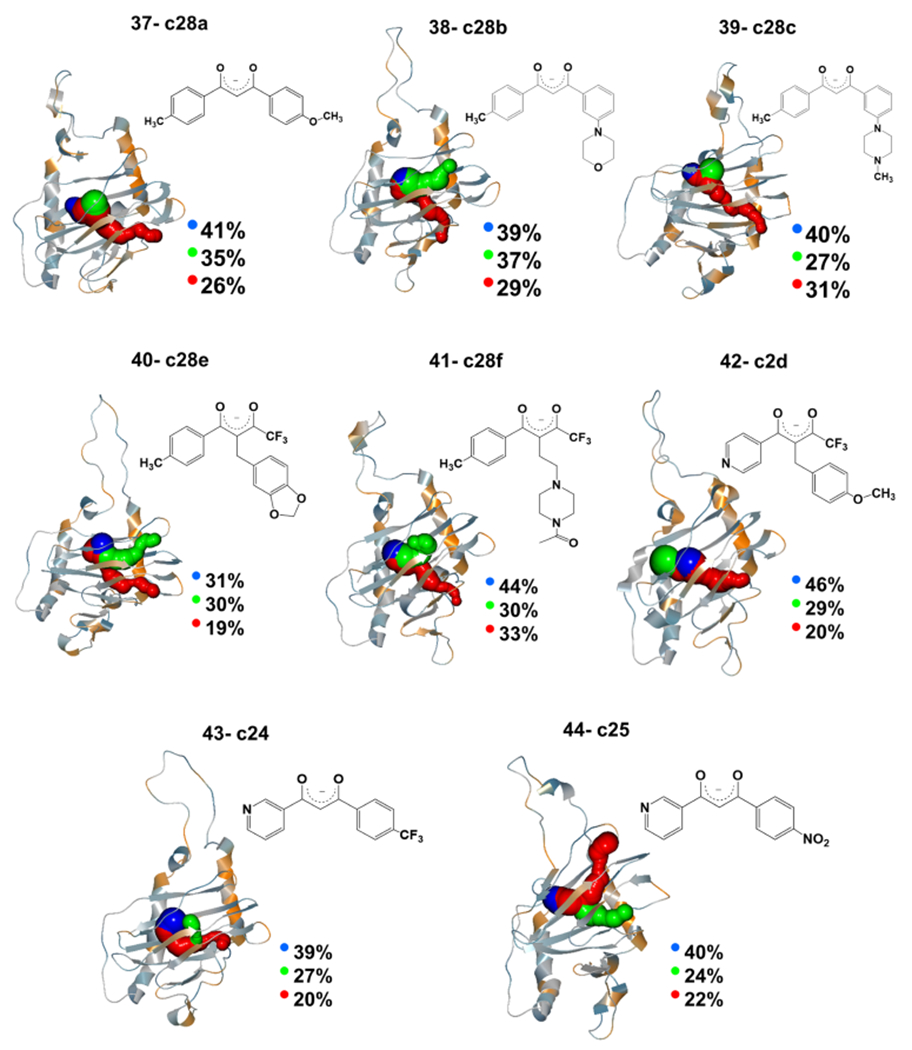
Figure 5.

O2-transporting tunnels with the largest calculated percentages along the trajectory observed in the third set of lead compounds. The twodimensional (2D) structure of each ligand is also given next to its tunnel graph. Calculated tunnels are colored in blue, green, and red based on the increase in the tunnel’s length. The intersection of the tunnels inside the protein is the active site of the inhibition reaction, but the active site’s residues are not shown for more clarity.
