
Fig. 2. Contrasting patterns of phylogenomic discordance.
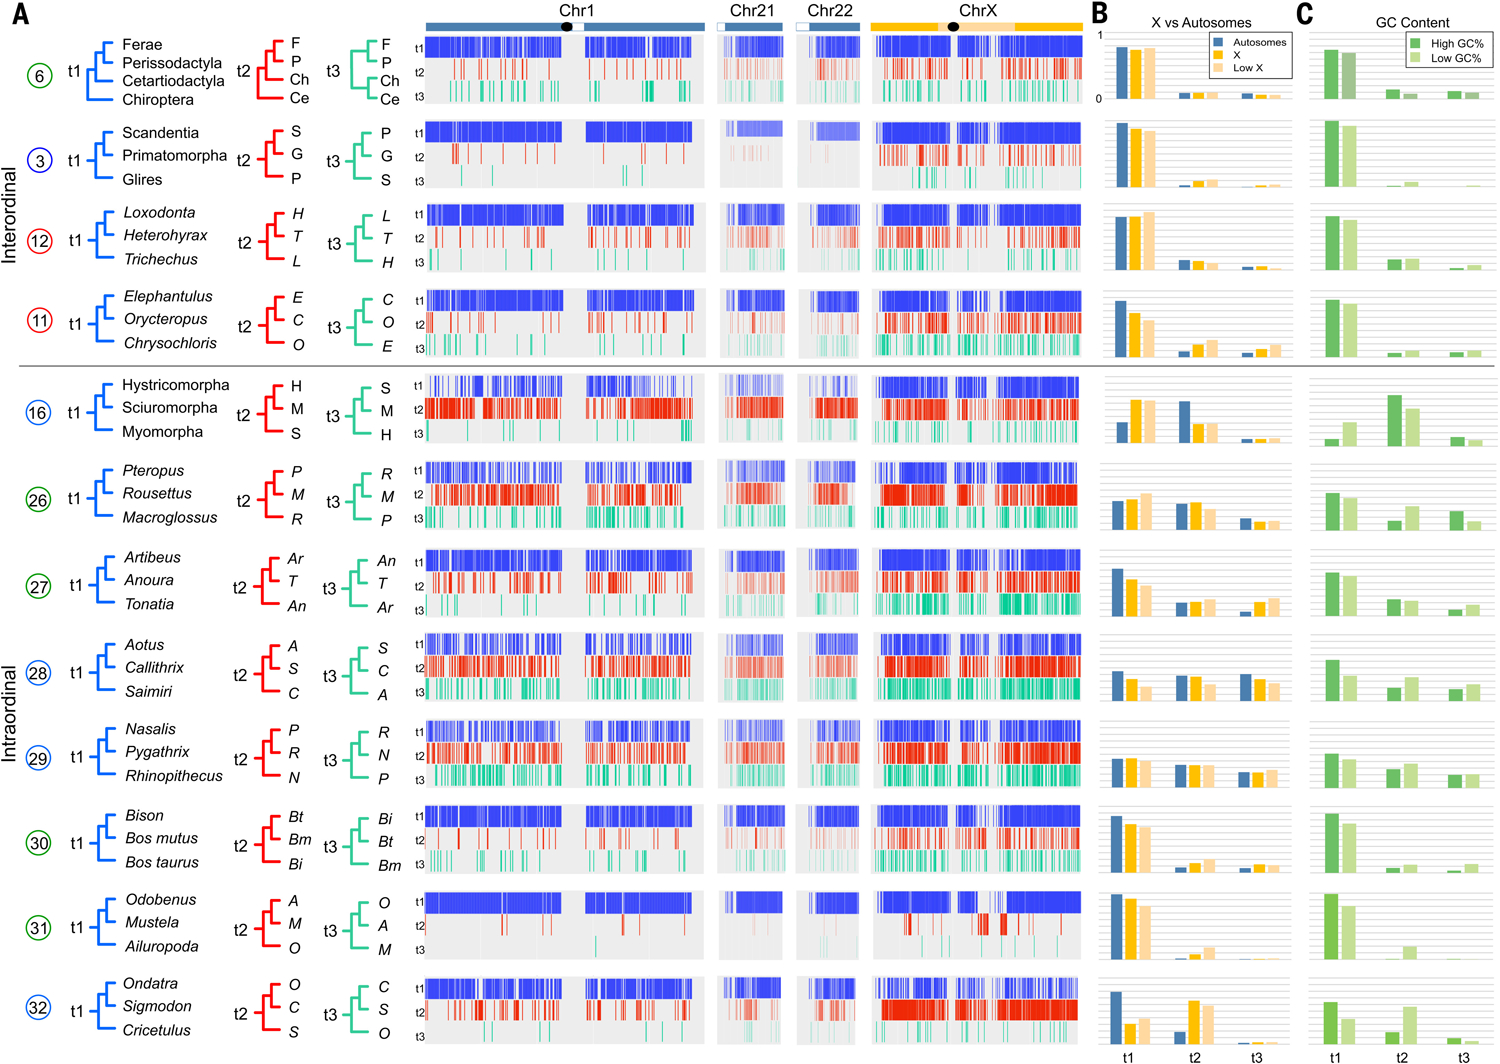
(A) Distribution of phylogenomic signal from select clades (table S5), visualized by using TreeHouseExplorer (23) in 100-kb alignment windows along human Chr1, Chr21, Chr22, and ChrX. Vertical bars along each chromosome are color-coded to indicate the distribution of the topology—t1, blue; t2, red; or t3, green, corresponding to topologies shown at left—that was recovered in the locus window. Black ovals indicate approximate positions of centromeres, and white boxes indicate heterochromatic regions. (B) Frequency of each topology on the representative autosomes, ChrX, and the low-recombining region of the X (4). (C) Relative topology frequencies in regions of high GC content (>55%) and low GC content (<35%). There are topological differences between ChrX and the autosomes, and corresponding GC content changes, for the primary intraordinal rodent clades, arctoid carnivorans, and cricetid rodents. Support for Zooamata was obtained by summing support for this clade across all three topologies at top. An alternately colored version of this figure is also available (fig. S8).