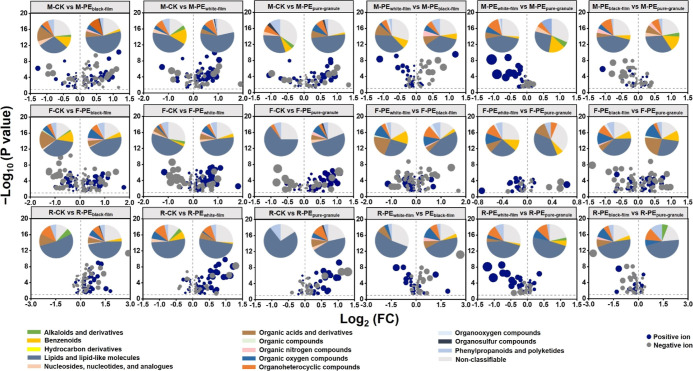
Figure 2.
Volcano-plot of fold changes (FC) in water extracted soil metabolites quantified when microplastics were introduced to different soil solutions [mollisol soil (M), red soil (R), and fluvo-aquic soil (F)]. The pie charts compare the distribution of the soil metabolites present in the two systems indicated. CK: solution without microplastics; PEblack-film: black polyethylene film microplastics; PEwhite-film: white polyethylene film microplastics; PEpure-granule: pure polyethylene microplastic granules. The FC value is quantified as the ratio of the concentrations of each metabolite group in the two systems. For example, within the chart of M-CK vs M-PEblack-film, FC = M-PEblack-film/M-CK. The positive Log2(FC) values mean those metabolites were abundant in M-PEblack-film, while the negative Log2(FC) values mean those metabolites were abundant in M-CK. The −Log10(p value) higher than 1.30 indicates that the significance of all data was in a level of p ≤ 0.05.

