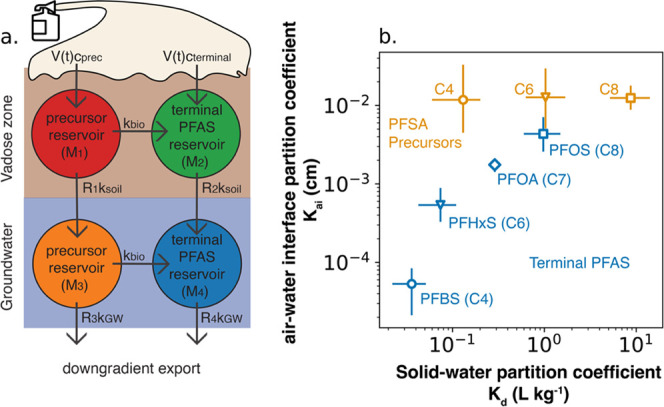
Figure 4.

Box model and optimized solid–water (Kd) and air–water interface (Kai) partition coefficients. (a) Reservoirs and mass transfer processes represented by the biogeochemical box model of the fire training area (eqs 1–5). (b) Optimized site-averaged Kd and Kai values for terminal PFAS (blue) and precursors (orange). Symbols represent the mean modeled values, and error bars denote the interquartile ranges from model simulations and are calculated using eqs S2 and S3. Raw data are provided in Table S18.
