
Figure 5.
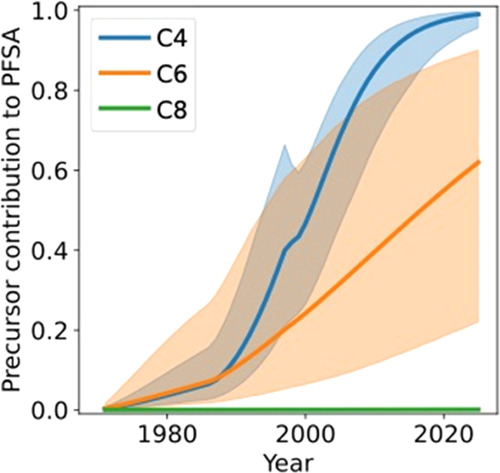
Contribution of precursor biotransformation to PFSA groundwater concentrations. The line represents the expected mean and the bounds represent the interquartile range (IQR) simulated using biogeochemical box models for the former fire training area at JBCC.