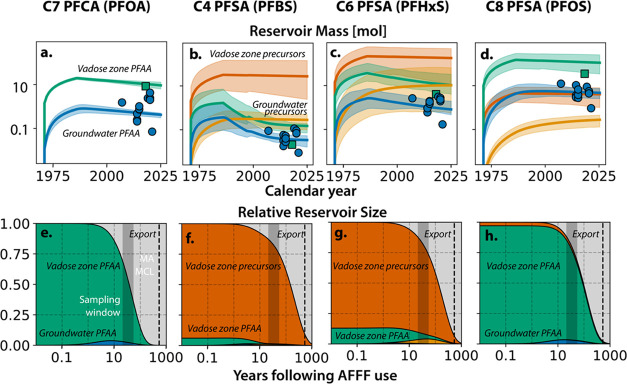
Figure 6.
Contemporary and projected future PFAS reservoirs beneath the fire training area. (a–d) Direct measurements as blue circles for groundwater (GW) and green squares for the vadose zone, and modeled reservoirs as lines (expected mean) and shaded regions (IQR) from the first use of the site to the present. (e–h) Projected distribution of PFAS in the vadose zone and groundwater following the use of 3M AFFF. The gray-shaded regions indicate the temporal range of sampling window in this study. The black dashed line indicates the year when concentrations in groundwater are expected to fall below the Massachusetts state-level MCL.

