
Figure 1.
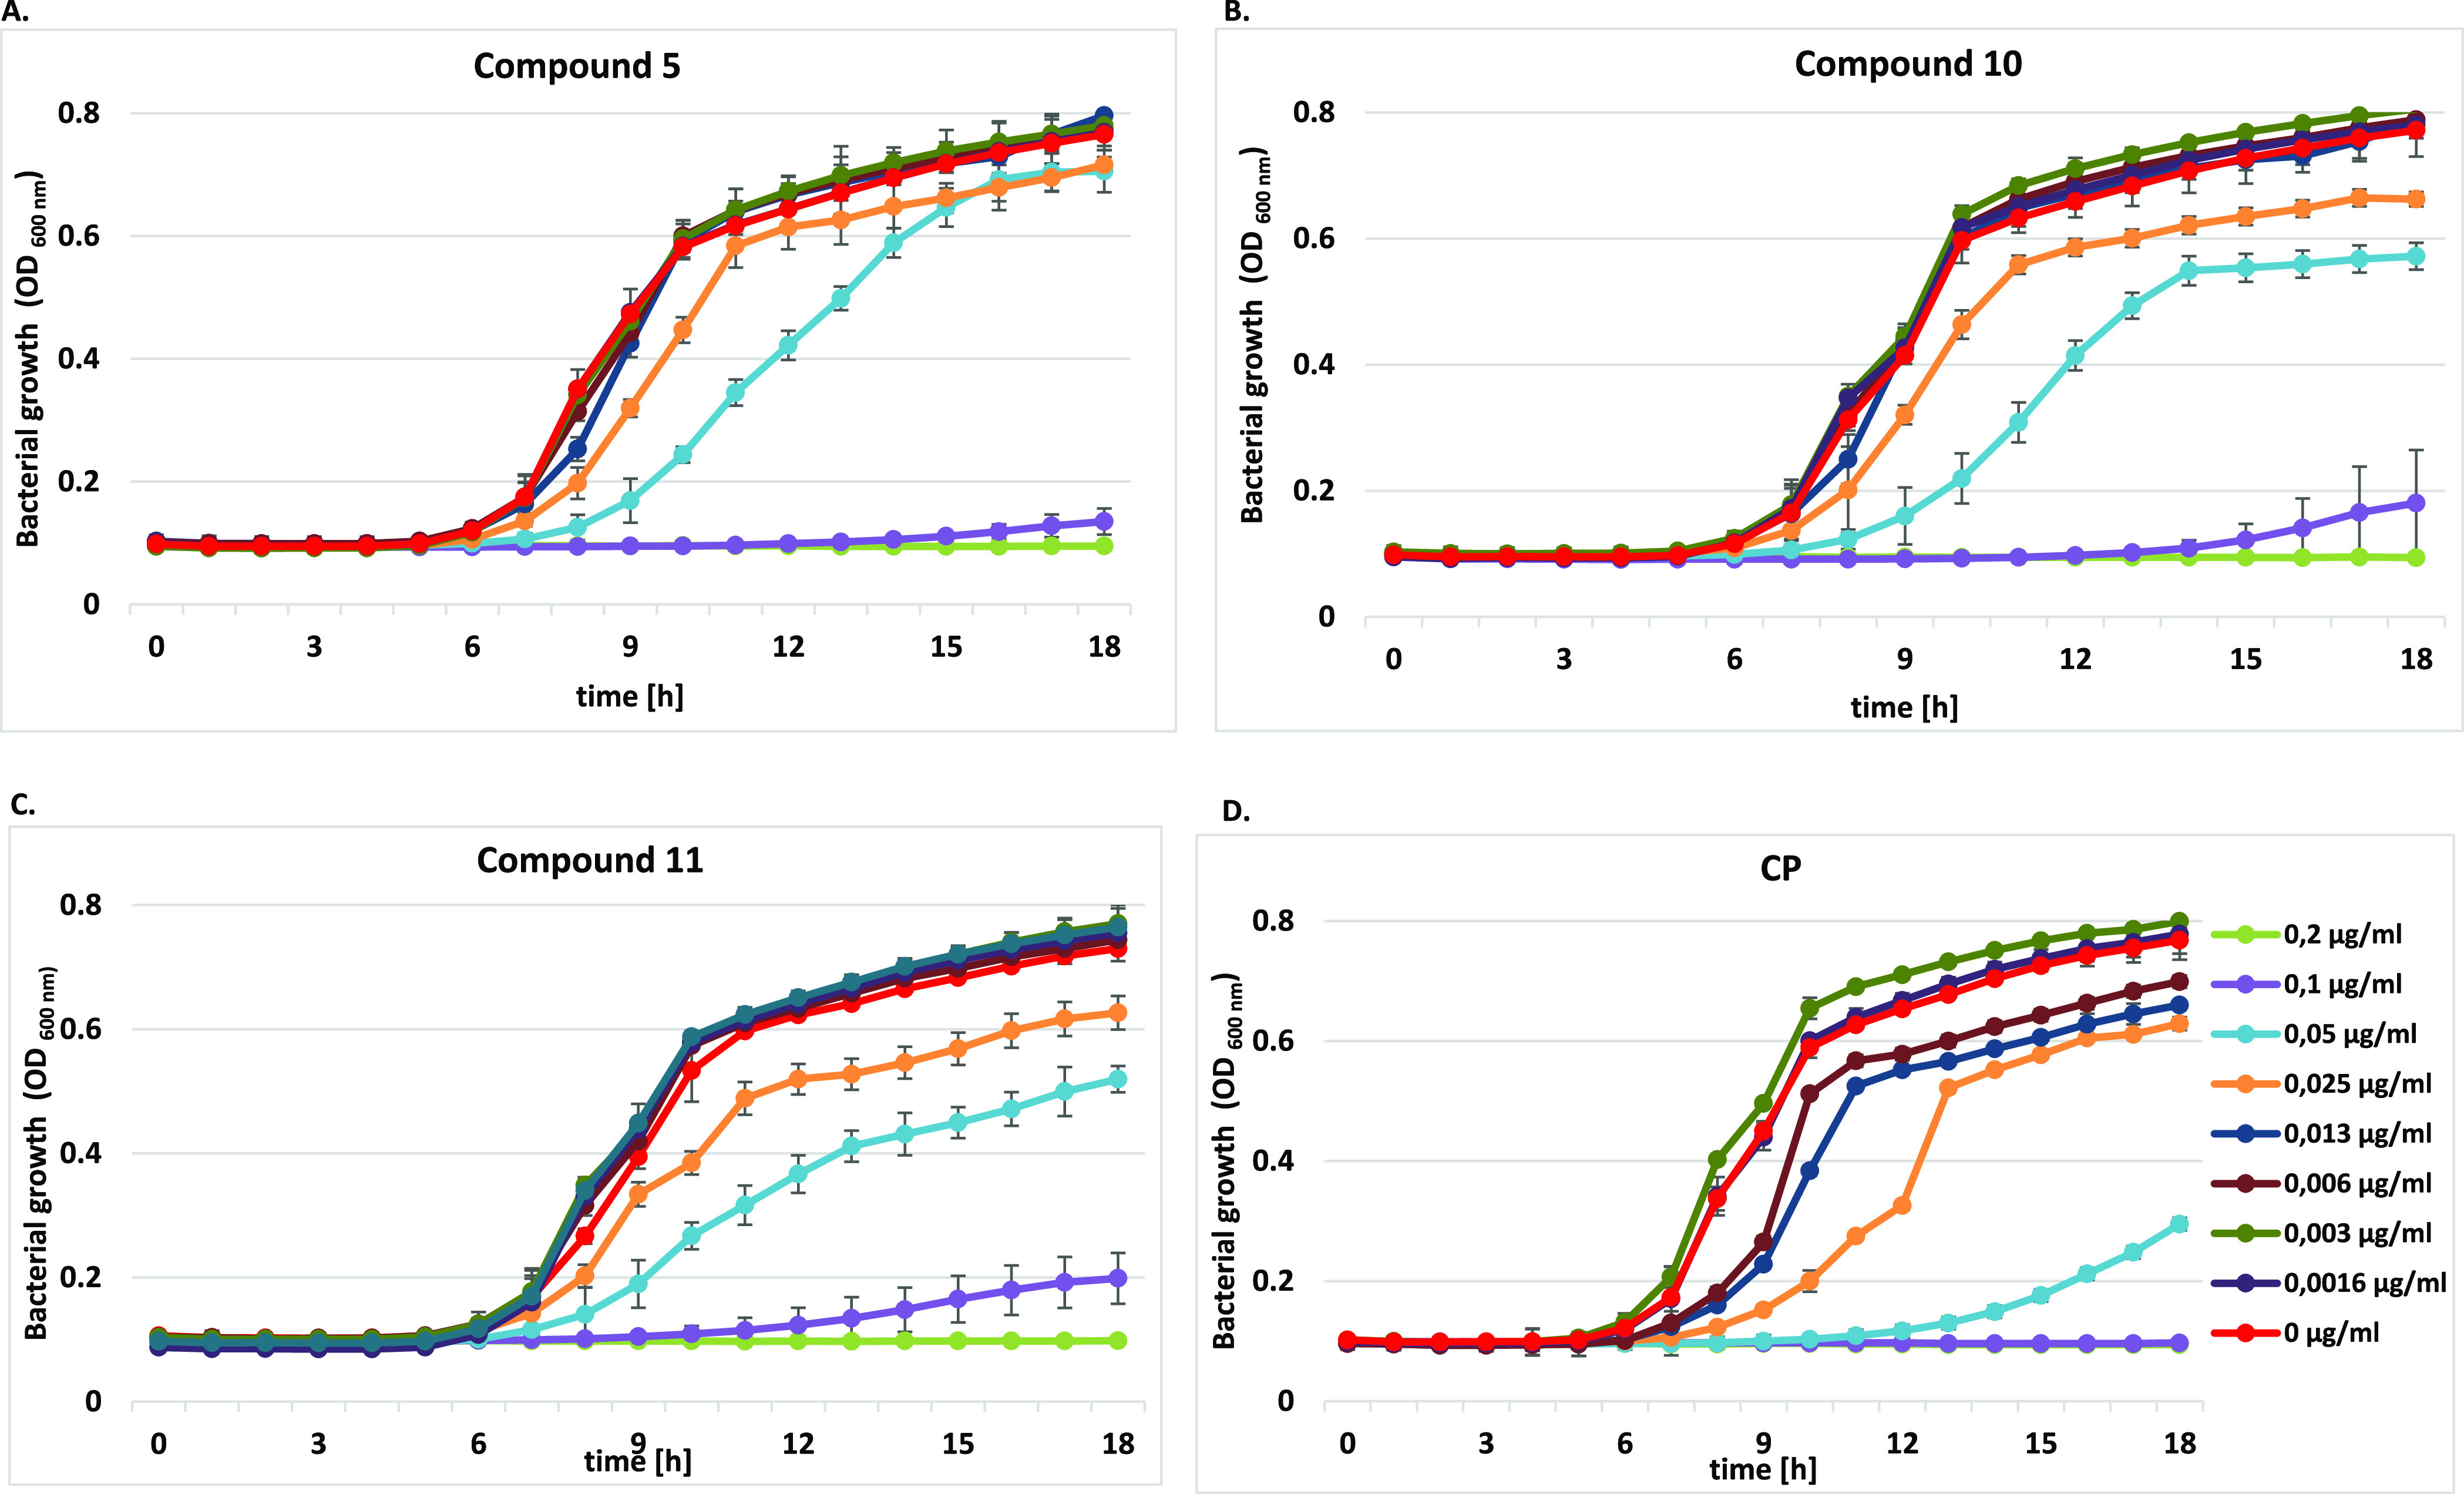
Growth curve analysis of P. aeruginosa ATCC 15442 at an absorbance of 600 nm (OD600) with or without different concentrations of (A) compound 5, (B) compound 10, (C) compound 11, and (D) CP for 18 h. The growth curve data were plotted as average values with standard deviations of n = 3.