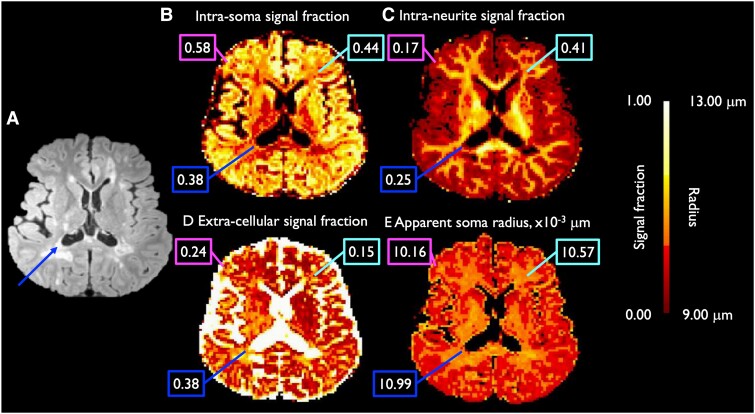
Figure 1.
Axial images of SANDI results. Maps include the T2-weighted FLAIR image (A), showing WM lesions (dark blue arrow), of a representative patient with MS, and the corresponding intra-soma (B), intra-neurite (C) and extra-cellular (D) signal fractions and apparent soma radius (E; in μm). Values within a specific voxel consisting cortical GM (magenta; upper left boxes), NAWM (light blue; upper right boxes) and WM lesion (dark blue; lower left boxes) are displayed in boxes. Values displayed in images B, C and D are signal fractions ranging from 0.00 to 1.00, and are therefore unitless.

