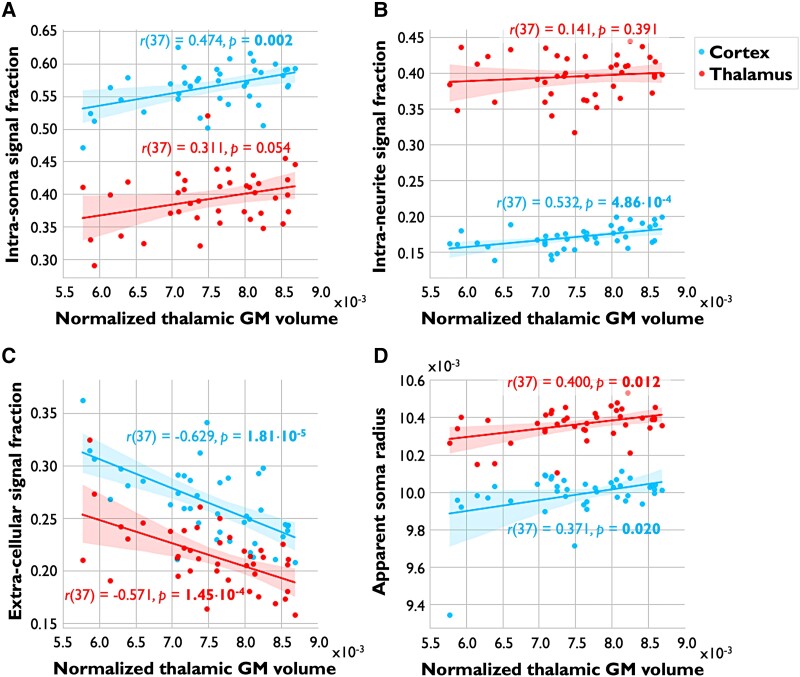
Figure 2.
Associations between SANDI metrics and thalamic volume. Imaging metrics in the cortex (blue) and thalamus (red) are shown on the y-axes and normalized thalamic volume on the x-axes in people with MS. Intra-soma (A), intra-neurite (B) and extra-cellular signal fractions (C) and apparent soma radius (D; in μm) are shown in separate plots. Correlation coefficients with corresponding P-values are displayed in representative colours near each plot. P-values <0.05 surviving FDR correction are marked in bold. Values on the y-axis in subplot A, B and C are signal fractions ranging from 0.00 to 1.00, and are therefore unitless. As thalamic volumes were corrected for intra-cranial volume, yielding normalized volume measures, values on the x-axis are unitless as well. GM, grey matter.

