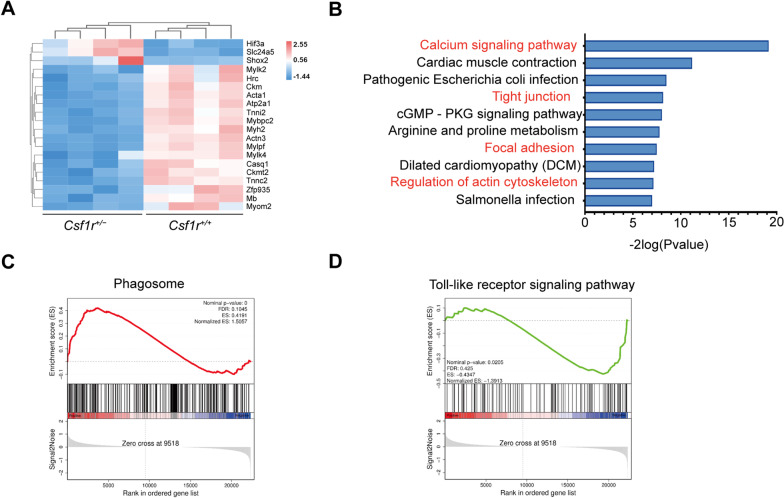
Fig. 2.
Transcriptomic differences in forebrain samples of Csf1r+/+ or Csf1r+/− male mice. A Heatmap showing differentially expressed genes (DEGs) in 9-month-old cerebral brains from four Csf1r+/+ or Csf1r+/− mice. The color key (from blue to red) of the Z-score value (− 1.44–2.25) indicates low to high expression levels. B. KEGG pathway analysis of DEGs showing enrichment for the phagosome-related pathways in the cortices of Csf1r+/− mice. The top ten high confidence pathways and phagocytosis-associated pathways (red). C, D GSEA of DEGs in forebrain samples of Csf1r+/+ or Csf1r+/− mice showing enrichment with upregulated gene sets in the phagosome pathway in CSF1R haploinsufficient mice (C) and enrichment with downregulated gene sets in the Toll-like receptor signal pathway (D)

