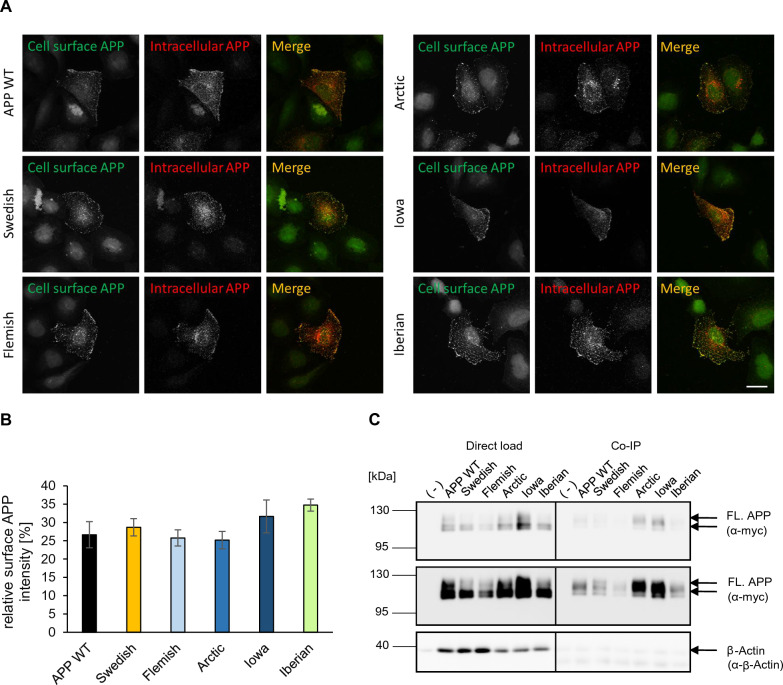
Fig. 3.
Presence of APP WT and APP FAD mutants at the cell surface. A Cell surface staining. HeLa cells were transiently transfected with N-terminally c-myc-tagged APP WT, Swedish, Arctic, Flemish, Iowa or Iberian. Cells were labeled with α-c-myc antibody (green, surface APP; red, total APP). The images were taken with an epifluorescence microscope including apotome. Scale bar: 20 μm. B ICC quantification. The relative surface APP intensity [%] indicates the percentage of APP present at the surface compared to total APP intensity. Bars represent mean values ± SEM; n = 18 (three biological replicates). Statistical analysis using one way ANOVA with Tukey`s post hoc test did not reveal any significant differences. C Cell surface biotinylation of transiently APP WT, Swedish, Arctic, Flemish, Iowa or Iberian transfected HEK293T cells. Direct load of cell lysates is shown in the left panel. In the right panel, APP cell surface levels after streptavidin immunoprecipitation and Western blot detection with anti-c-myc antibody are shown. β-Actin served as a loading control and was detected in the IP samples only to a minor extent, which confirms specificity of the pull down of surface proteins. The lower panel shows a higher exposure time

