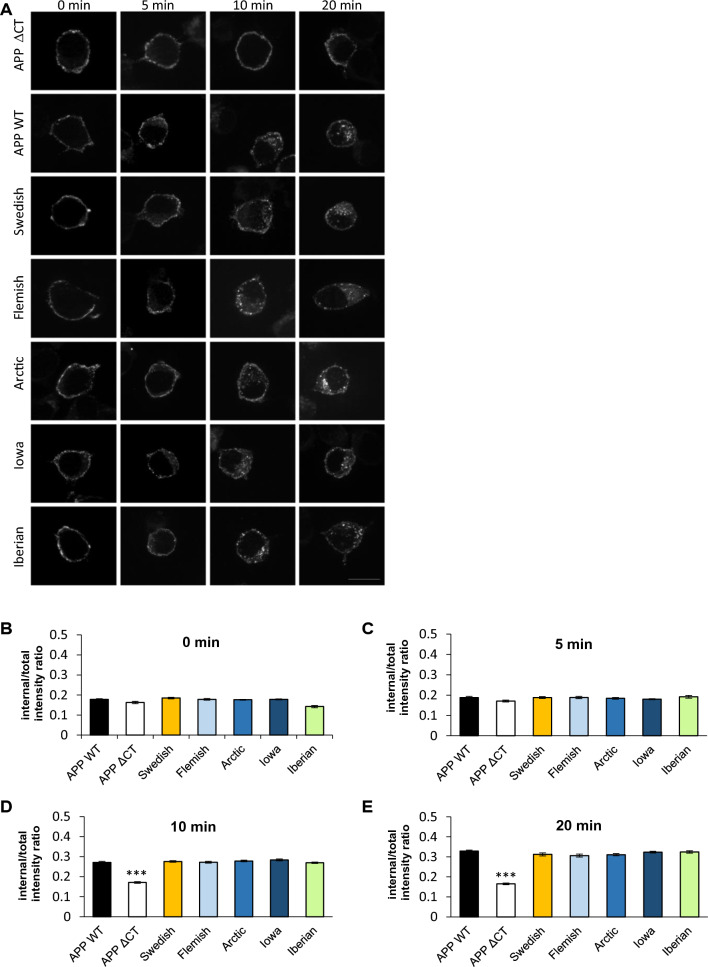
Fig. 6.
Internalization rate of APP WT compared to APP FAD mutants. An antibody-uptake assay was performed using APPΔCT as a negative control. A N2a-cells expressing N-terminally c-myc-tagged APP WT, Swedish, Flemish, Arctic, Iowa, Iberian or APPΔCT were incubated with a mouse anti-c-myc antibody at 4 °C. Subsequently, the cells were placed at 37 °C, allowing antibody uptake. After 0, 5, 10, or 20 min, cells were fixed and incubated with an anti-mouse Alexa Fluor 488-conjugated secondary antibody to mark surface APP. Afterwards, the cells were permeabilized and stained with an anti-mouse Alexa Fluor 594-conjugated secondary antibody. Representative immunofluorescence images of N2a cells transiently transfected with N-terminally c-myc APP WT or the indicated APP mutants showing only the signal of Alexa Fluor 594 representing endocytosed and remaining surface APP. Scale bar, 10 µm. B Quantification of internal/total intensity ratio for APP WT and the APP mutants analyzed at 0, 5, 10, and 20 min. Bars represent mean values ± SEM; n > 30 (three biological replicates). Statistical analysis was performed using Kruskal–Wallis test followed by Dunn’s multiple-comparison test; (*p < 0.05, **p < 0.01, ***p < 0.001)

