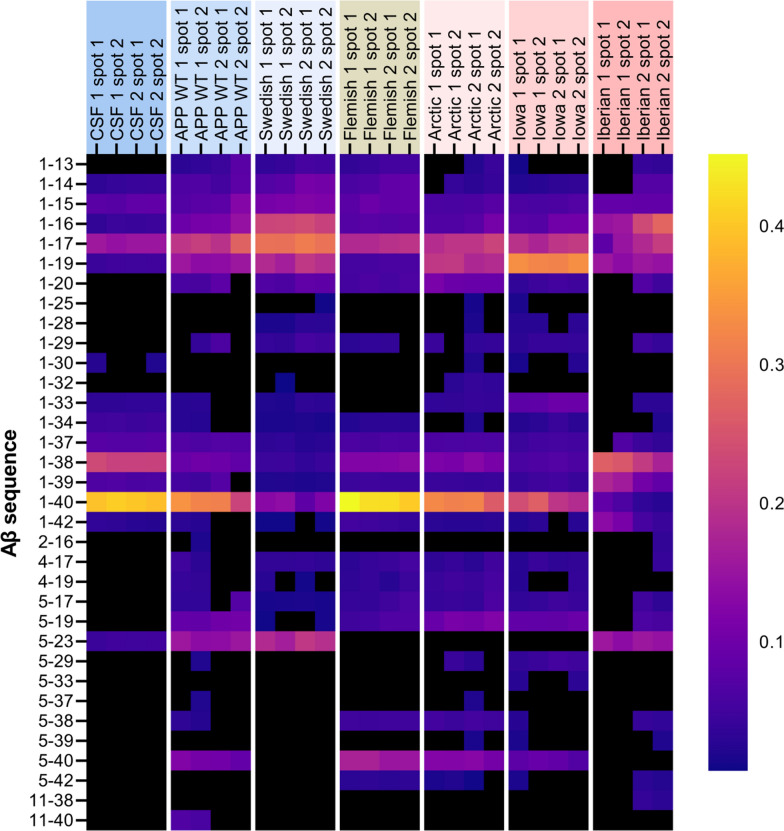
Fig. 9.
Normalized heatmap of Aβ peptide sequences observed during IP-MALDI-TOF on APP WT and APP FAD mutants. The four columns per sample type represent the two biological replicates (1 and 2) each with two technical MALDI-TOF replicates (spot 1 and spot 2). Normalization was performed by dividing peak area of individual Aβ proteoforms by the total peak area of all identified Aβ peaks in the sample’s spectrum. Black indicates the total absence of the peptide sequence in the spectrum, which may not necessarily always indicate the absence in the sample

