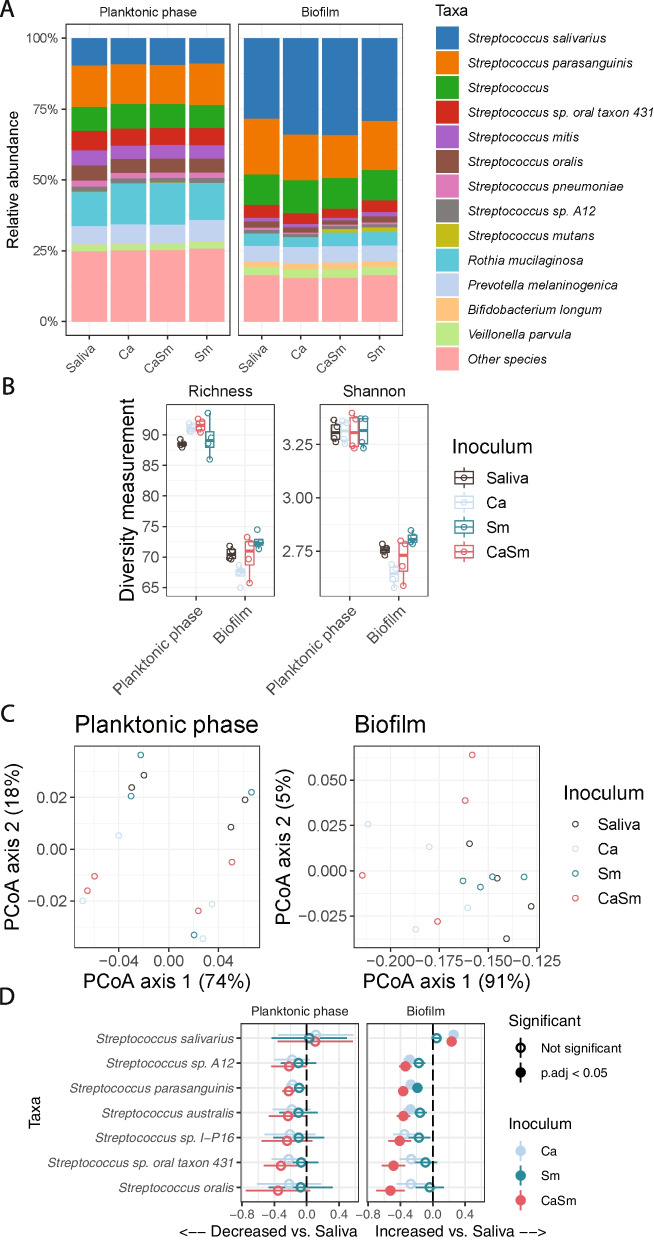
Fig. 4.
Effects of introducing opportunistic pathogens on planktonic and biofilm microbiota with sucrose. A Bacteria relative abundance within planktonic phases and biofilms when introducing S. mutants and/or C. albicans. B Alpha diversity of planktonic and biofilm samples with different pathogens. C Principle coordinates analysis plot of Bray–Curtis dissimilarity between samples with S. mutants and/or C. albicans. X and Y axis show the percentage of total variance captured. D Difference in log2-transformed abundances of bacterial species as a result of adding S. mutants and/or C. albicans. Bars indicate ± standard error in the linear mixed-effects model. Taxa shown are those that had FDR < 0.05 in the linear mixed-effects model. Ca—C. albicans, Sm—S. mutans, CaSm—C. albicans + S. mutans

