Figure 3.
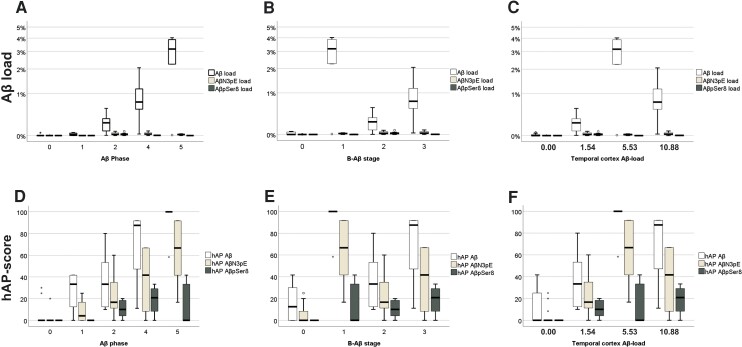
Relationship between ‘donor’ Aβ pathology and propagation and maturation in the ‘host’ brain. Box plot diagrams of the induced Aβ loads (A–C) and hAP scores (D–F) with the Aβ phases (A and D), B-Aβ stages (B and E) and temporal cortex Aβ loads (C and F), of the respective cases used for the generation of the brain lysates. ANOVA indicated an increasing tendency of the induced hAP scores for all three Aβ species with increasing Aβ phase of the injected ‘donor’ brains (ANOVA: P ≤ 0.023, n = 38 mice) and Aβ load (ANOVA: P < 0.001, n = 38 mice). AβN3pE and AβpSer8 loads did not increase continuously with Aβ phase although ANOVA indicated differences among the groups (ANOVA: P ≤ 0.005, n = 38 mice). Increasing B-Aβ stages and temporal cortex Aβ loads of the ‘donor’ brains did not go along with a continuous increase of the induced Aβ and AβN3pE loads and hAP scores and the AβpSer8 load, whereas the AβpSer8 hAP score continuously rose. Note that the Aβ loads and hAP scores for Aβ detectable with antibodies raised against non-modified forms of Aβ were higher than those for AβN3pE and AβpSer8 in mice with Aβ pathology [Friedman test corrected for multiple testing (two-sided): P < 0.01, n = 24 mice; see also Supplementary Table 2B]. Box elements: centre line = median; box limits = upper and lower quartiles; whiskers = 1.5× interquartile range; dots/stars = outliers.

