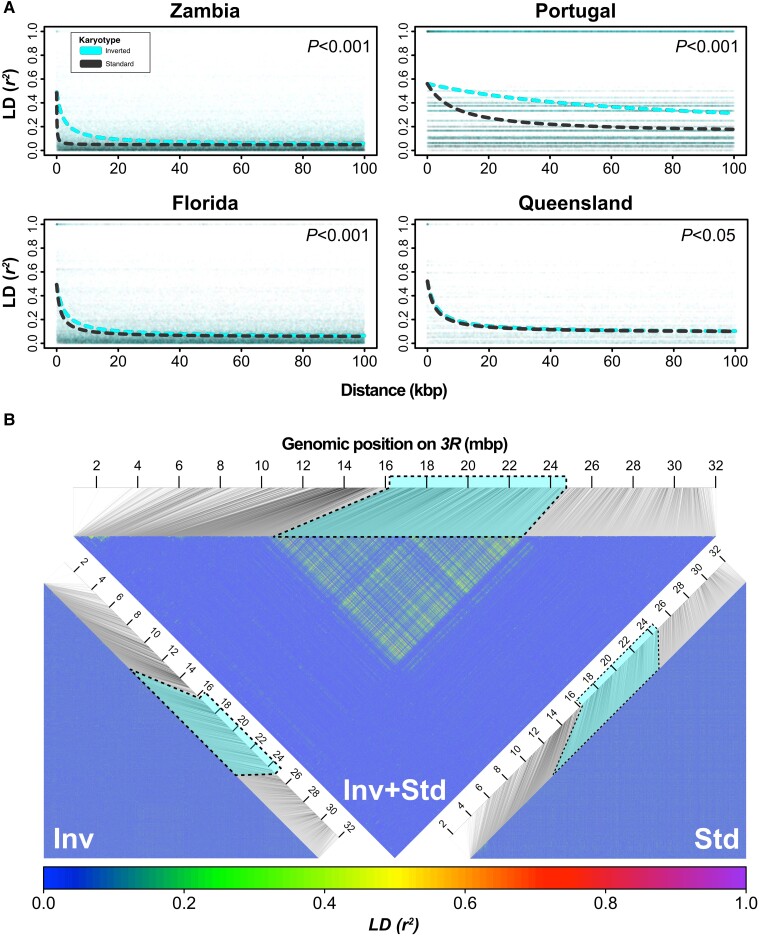
Fig. 3.
Patterns of short- and long-range LD in the region spanned by In(3R)Payne. (A) Distribution and decay of LD as estimated by r2 within 100-kb distance, based on 5,000 randomly drawn SNPs inside the region spanned by In(3R)Payne for standard (gray) and inverted (cyan) chromosomes from different geographic samples. Significant P values in the top right corners of the plots indicate differences in the decay of LD among karyotypes as inferred from analyses of deviance applied to nonlinear regression models (see Material and Methods for details). (B) Triangular heat maps with estimates of r2 for 5,000 SNPs randomly drawn from chromosomal arm 3R in samples from North America (Florida). We restricted our analyses to subsamples of 5,000 SNPs due to computational reasons: n = 5,000 SNPs implies n(n-1)/2 = 12,497,500 pairwise comparisons, with much larger numbers becoming computationally prohibitive. In the upper triangle, r2 was estimated jointly for inverted and standard chromosomes (see supplementary fig. S3, Supplementary Material online, for similar plots for the other continents). The bottom left and right plots show separate r2 estimates for inverted and standard chromosomes, respectively.

