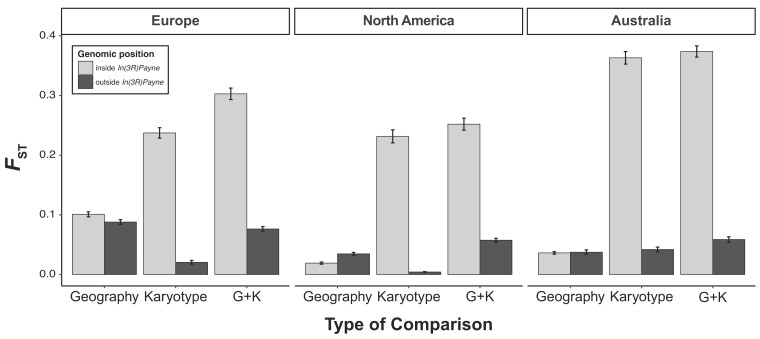
Fig. 5.
Genetic differentiation (FST) as a function of In(3R)Payne karyotype and/or geography. Bar plots show average values of FST in 100-kb nonoverlapping windows in different genomic regions relative to In(3R)Payne (inside vs. outside the inverted region) for the three non-African continents (Europe, North America, and Australia) which include clinal (low- vs. high-latitude) populations samples. The different bars represent pairwise FST comparisons for 1) geographic differentiation (“G,” comparing standard arrangement chromosomes from populations at the endpoints of clines), 2) karyotypic differentiation (“K,” comparing inverted and standard arrangement chromosomes sampled from within the same low-latitude populations), and 3) geographic plus karyotypic differentiation (“G + K,” comparing inverted chromosomes from low-latitude populations with standard chromosomes from high-latitude populations). See Materials and Methods for details; also see figure 4 and table 2 for statistical analyses.

