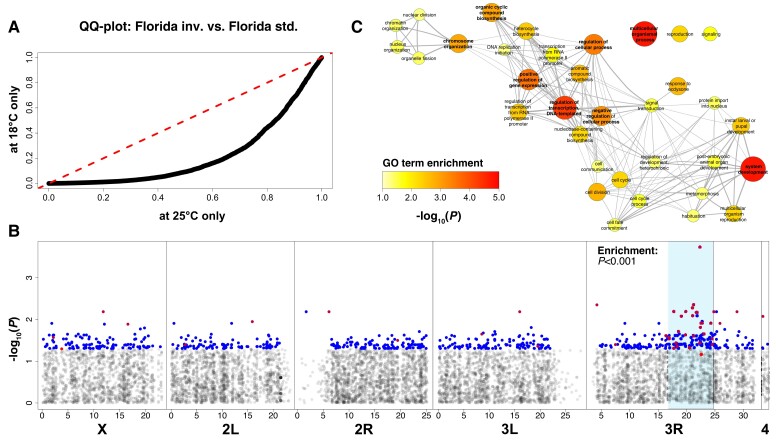
Fig. 8.
Transcriptomic analyses of In(3R)Payne karyotypes. (A) Q–Q plot comparing P values from DE analyses with limma voom between North American 3R Payne inverted and standard chromosomes at 18 °C and 25 °C, respectively. Since karyotype-specific DE was much stronger at 18 °C, we focused on this data set for downstream analyses. (B) Manhattan plot depicting −log10(P)-values for each gene relative to its average genomic position. Candidate genes with karyotype-specific expression irrespective of temperature are highlighted in red; those showing karyotype-specific expression at 18 °C only in blue; and those that are candidates in both data sets are highlighted in purple. Candidates of both data sets are enriched within the region spanned by 3R Payne. (C) Significant GO terms based on DEGs among karyotypes at 18 °C with BH-adjusted P < 0.05. Also see supplementary table S5, Supplementary Material online and Materials and Methods for further details.

