
Figure 1. Lymphoid tissue organomegaly and the composition of inflammatory cells at 18 weeks of age.
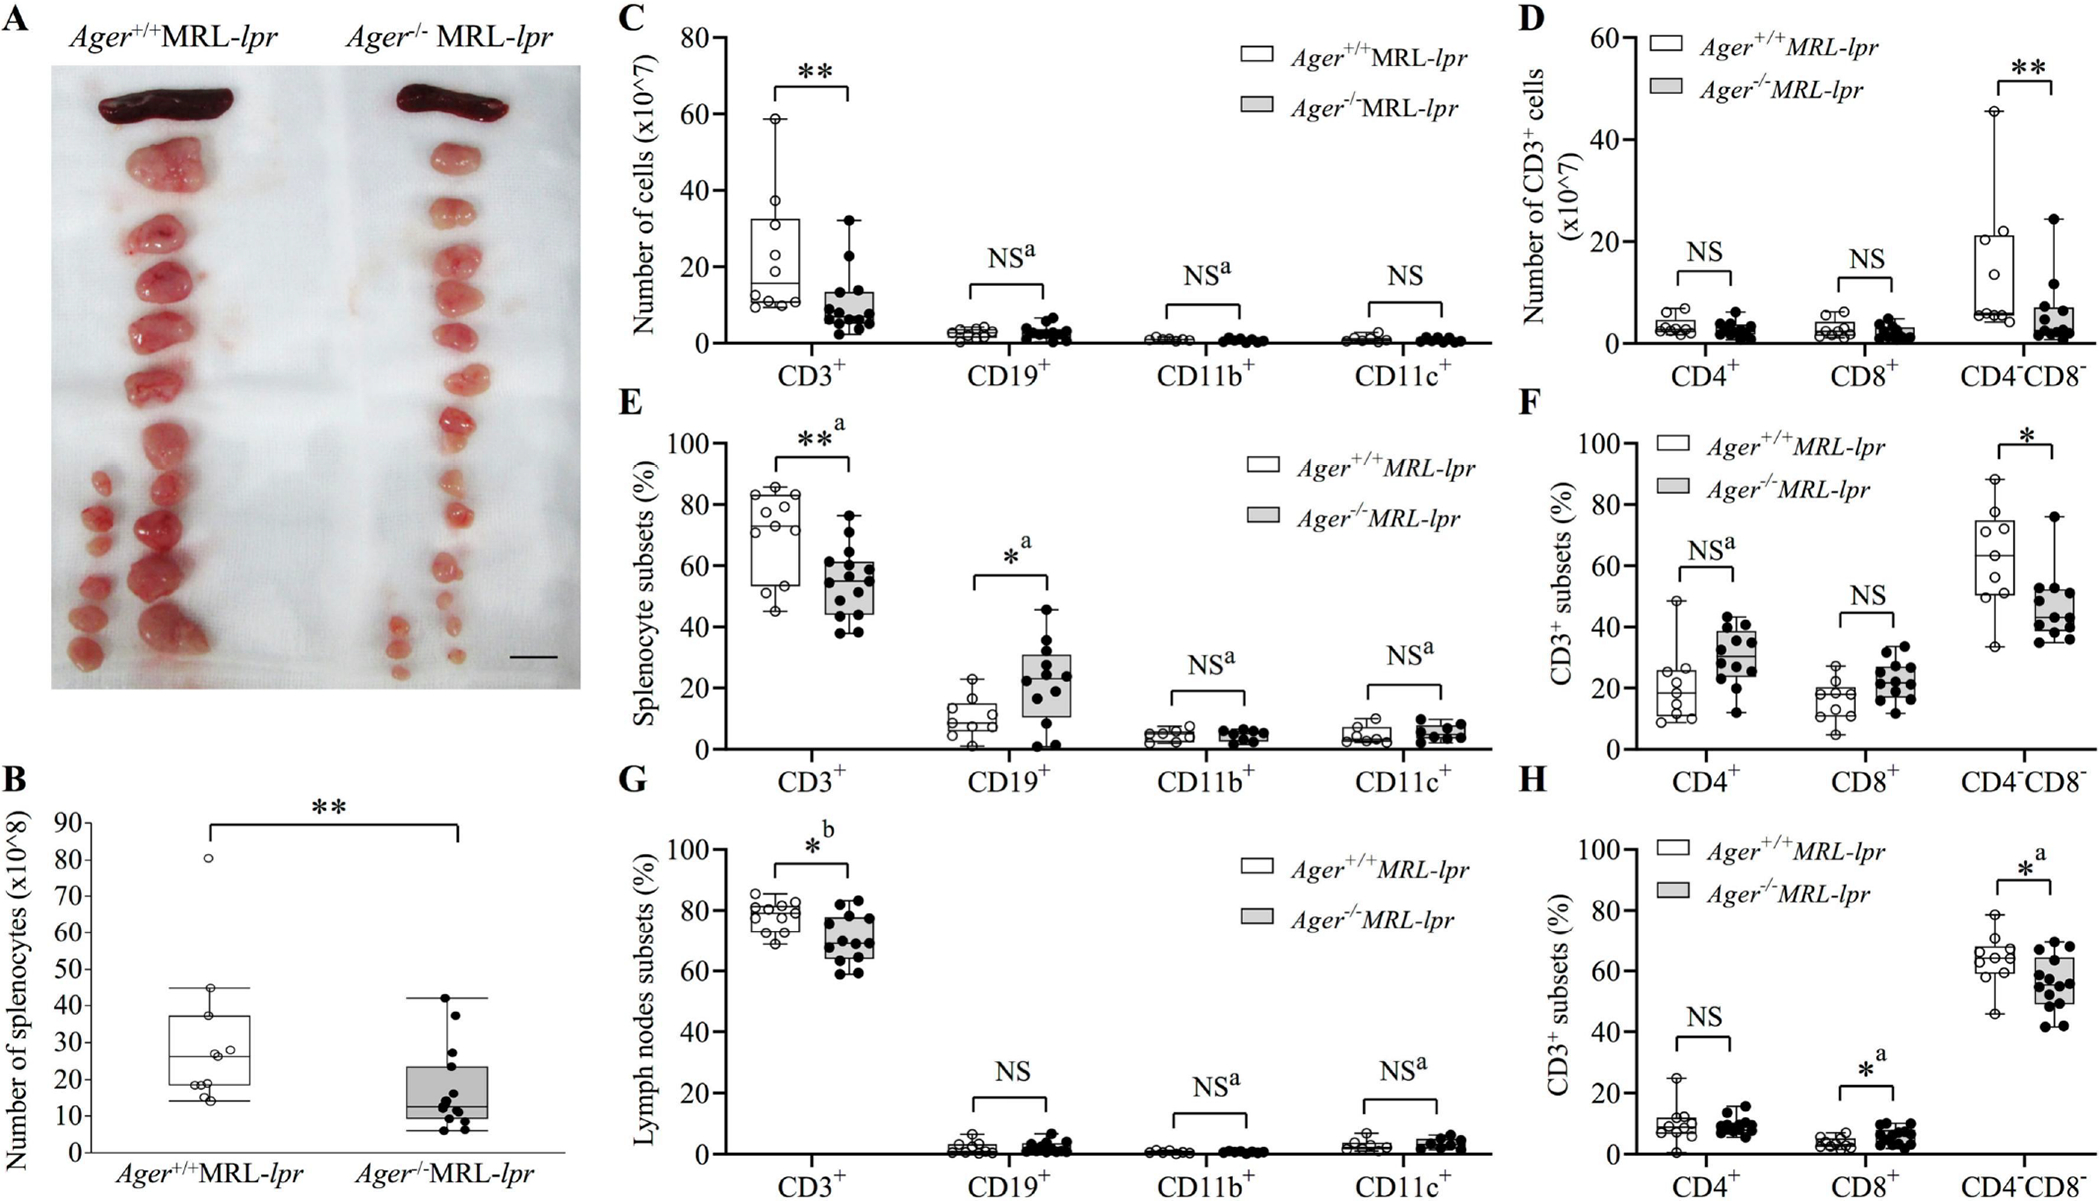
(A) Representative image of spleens and lymph nodes. The bar indicates 1 cm. (B) The total number of splenocytes Ager+/+ MRL-lpr (n = 11), and Ager−/− MRL-lpr (n = 15). Student’s t-test. **p < 0.01. (C-F) Comparisons of the absolute numbers or proportions of splenocyte subsets (C, E) and the absolute numbers or proportions of CD3+ cells in the spleen (D, F). The proportions indicate the percentages in total splenocytes. (G) Comparisons of the proportions of lymph node subsets. (H) Comparisons of the proportions of CD3+ cells in lymph nodes. The proportions indicate the percentages in total lymph node cells. (C-H) CD3+ cells were evaluated in 10 Ager+/+ MRL-lpr and 14 Ager−/− MRL-lpr mice. CD19+ cells were evaluated in 9 Ager+/+ MRL-lpr and 12 Ager−/− MRL-lpr mice. CD11b+ or CD11c+ populations were compared between 7 Ager+/+ MRL-lpr and 8 Ager−/− MRL-lpr. aStudent t-test; bWelch’s t-test. The Mann‒Whitney U test was used if not stated otherwise. *P < 0.05; **P < 0.01. NS, not significant.