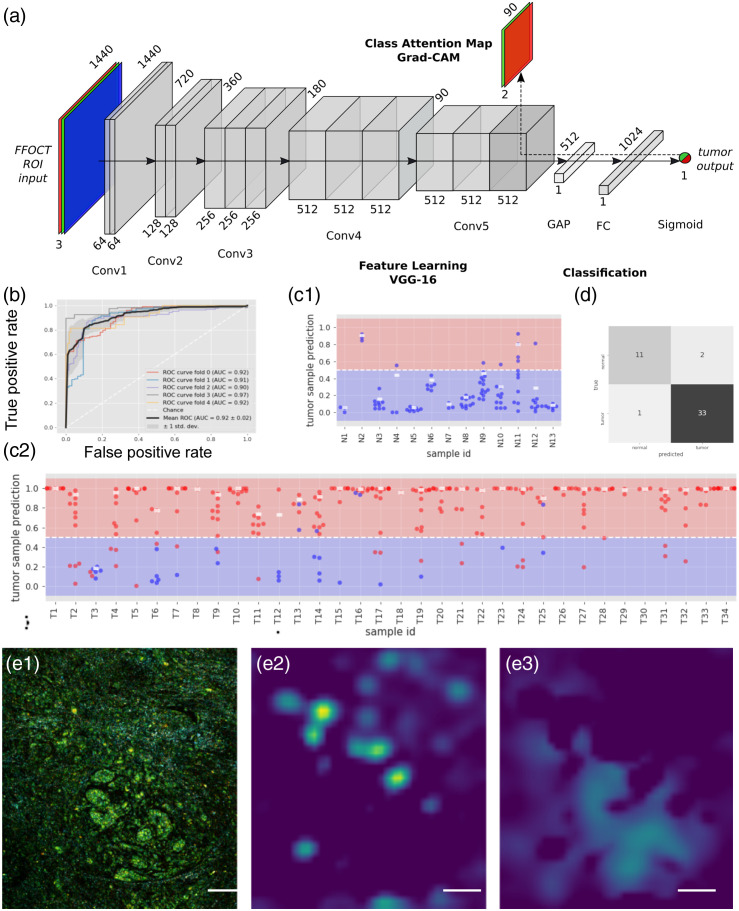
Fig. 5.
CNN classification of breast cancer. (a) Structure of the CNN used for D-FF-OCT CNN classification. The CNN can be used to provide a probability output at the end. An alternative is to propagate the gradients from the last convolutional layer using the GradCAM algorithm in order to retrieve some spatial information from the CNN. (b) ROC curves and AUCs of the fivefold cross validated models. (c) Tumor probability prediction by the CNN for each ROI in each sample, either (c1) healthy or (c2) tumoral. Each point represents an ROI where ground truth diagnosis is either healthy (blue) or tumoral (red). The white rectangle represents the aggregated tumor probability per sample, computed as the 90th percentile of the probabilities of the ROIs in a sample. (d) The sample scale diagnosis is found by applying a threshold at 50% for this 90th percentile. For each ROI, the Grad-CAM algorithm allows to recover attention maps. As an example, from an ROI showing healthy breast lobule surrounded by isolated infiltrating cancerous cells, correctly predicted as cancerous with 97% confidence by the CNN (e1), the tumor positive attention map (e2) focuses on the regions with the infiltrating cells, and the the tumor negative attention map (e3) shows healthy regions, including the healthy breast lobule. Scale bars are in (e).

