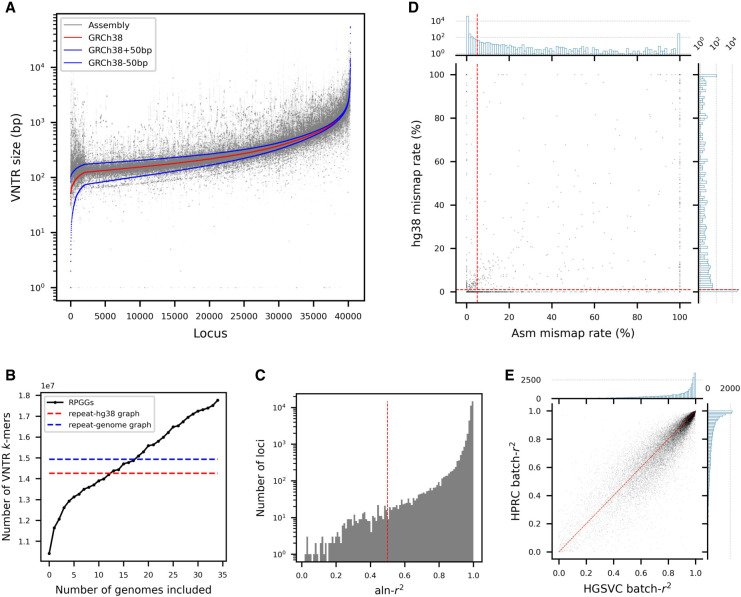
Figure 2.
Characteristics of VNTRs and the RPGG. (A) Size distribution of VNTR alleles across 35 HGSVC assemblies. Each dot represents the size of a VNTR locus in an assembly. The orders of 40,314 VNTR loci were sorted according to size in GRCh38. (B) Cumulative graph sizes. A total of 35 repeat-genome graphs were incrementally added to the RPGG in the order of their respective graph size. The red dashed line denotes the size of the repeat graph built from GRCh38. The blue dashed line denotes the average size of the graphs built from assemblies. (C) Distribution of aln-r2 for all locus-RPGGs. The aln-r2 of each locus was computed by regressing the assembly k-mer counts against the read k-mer counts from graph alignments. The cutoff for aln-r2 (0.5) is shown in red dotted lines. (D) Distribution of assembly and GRCh38 mismap rates for all locus-RPGGs. The cutoffs for assembly (5%) and GRCh38 (1%) mismap rates are shown in red dotted lines. The histograms represent the marginal distribution for each variable. (E) Distribution of VNTR dosage between-sample correlation batch-r2 on the HGSVC and HPRC data sets, with the diagonal with slope of 1 in red.

