Figure 3.
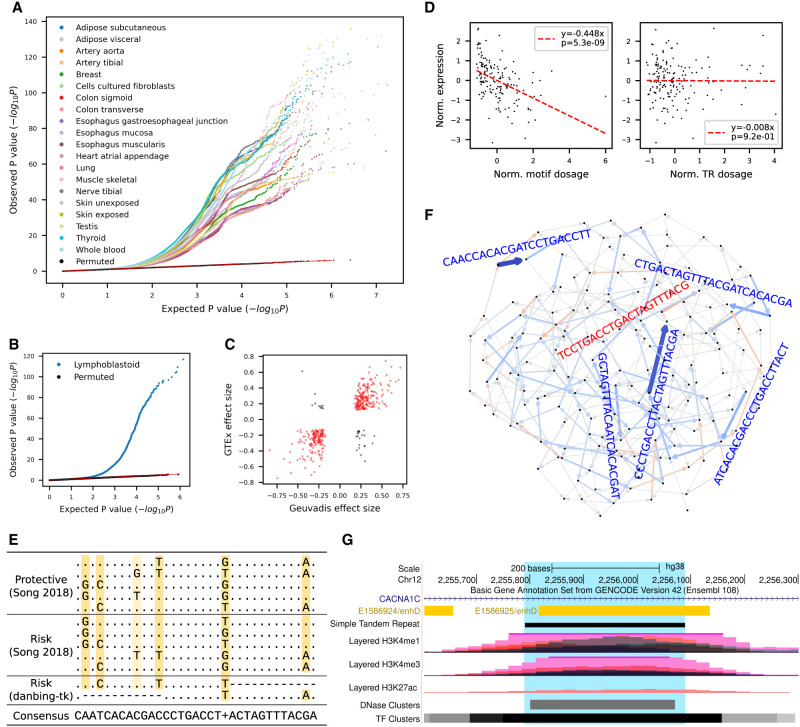
cis-eQTL mapping of VNTR motifs. (A) Quantile–quantile plot of gene-level eMotif discoveries across 20 human tissues from GTEx data sets. The expected P-values (x-axis) were drawn from Unif(0,1) and plotted against observed nominal association P-values. (B,C) Replication on the Geuvadis data set. (B) The quantile-quantile plot shows the observed P-value of each association test (two-sided t-test) versus the P-value drawn from the expected uniform distribution. Black dots indicate the permutation results from the top 5% associated (gene, motif) pairs. (C) Correlation of eMotif effect sizes between Geuvadis and GTEx whole-blood tissue. Only eGenes significant in both data sets were shown. Each pair of gene and motif that has the same/opposite sign across data sets were colored in red/black. (D–F) Identification of risk motifs for CACNA1C expression. The motifs in CACNA1C VNTR at Chr 12: 2,255,789–2,256,088 were analyzed. (D) Association of CACNA1C VNTR motif CAACCACACGATCCTGACCTT (left) or VNTR length (right) with gene expression in the brain cerebellar hemisphere. (E) Multiple sequence alignment of known CACNA1C risk motifs (Song et al. 2018) and the likely causal eMotifs reported in this study. (F) Graph visualization of motif effect sizes from the CACNA1C VNTR. Each edge denotes a motif and is colored blue/red if having a negative/positive effect on gene expression. Color saturation and edge width both scale with the absolute value of effect size. The sequence of a motif is shown parallel to the edge and is colored in dark blue if having a significant effect or is colored in light red/blue if borderline significant. (G) UCSC Genome Browser view (Kent et al. 2002) of CACNA1C VNTR.

