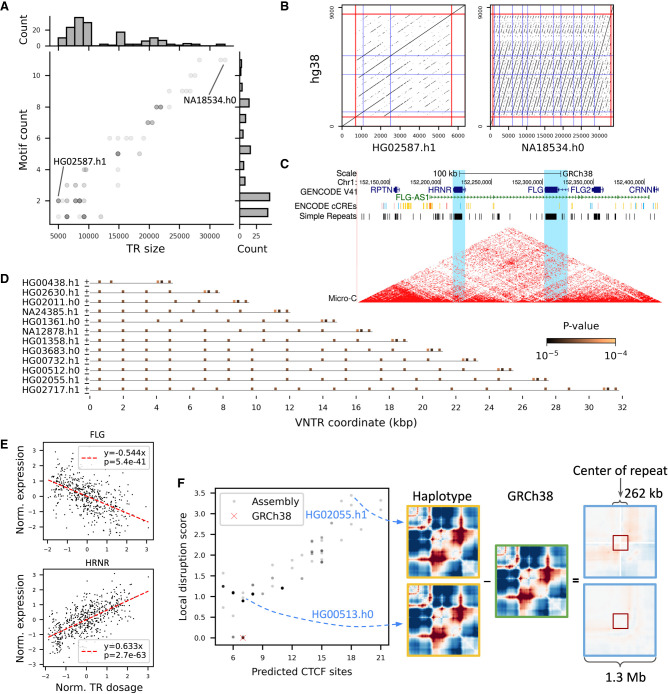
Figure 5.
HRNR repeat expansion impacts nearby gene expression. (A,B) VNTR allele diversity of the HRNR repeat (Chr 1: 152,213,243–152,221,044). (A) The VNTR lengths and counts for motif AGGAGTGCCCCAAACCGGACCCATGTCGGCCG in the HGSVC and HPRC assemblies are shown (matplotlib alpha = 0.2). (B) Two divergent haplotypes in A are highlighted with dot plots. Red lines indicate the boundary of the repeat, flanked by 700-bp sequences on both sides. The locations of the motif in GRCh38 and assemblies are shown as blue lines. Each dot denotes an exact match of 21-mers. (C) UCSC Genome Browser (Kent et al. 2002) view of HRNR, FLG, and FLG-AS1. Blue, red, and yellow lines in the ENCODE cCRE track denote CTCF sites, promoters, and enhancers, respectively. Micro-C chromatin structure from HFFc6 cell line is shown. HRNR and FLG are highlighted in light blue. (D) Predicted CTCF binding sites across 13 length-divergent haplotypes. Each haplotype was scanned for matches with a 34-bp, two-core CTCF motif (MA1929.1) using FIMO with a cutoff of P < 10–4. Plus and minus signs at the start of each haplotype indicate the orientation of the motif. (E) Association of the estimated HRNR repeat size in GTEx genomes with FLG (in fibroblast) and HRNR (in thyroid) expression. Red dashed lines indicate the best fit under simple linear regression. (F, left) The number of predicted CTCF sites versus disruption of local genome folding predicted by Akita for alternate VNTRs among 83 assemblies. Each variant VNTR is shown as a gray dot with a shade reflecting the multiplicity of alleles that have the similar numbers of CTCF sites and disruption scores. A higher local disruption score reflects greater changes in contact frequencies relative to GRCh38 in a 262-kb window. (Right) Illustration of how a local disruption score is calculated comparing predicted folding in a haplotype to GRCh38.

