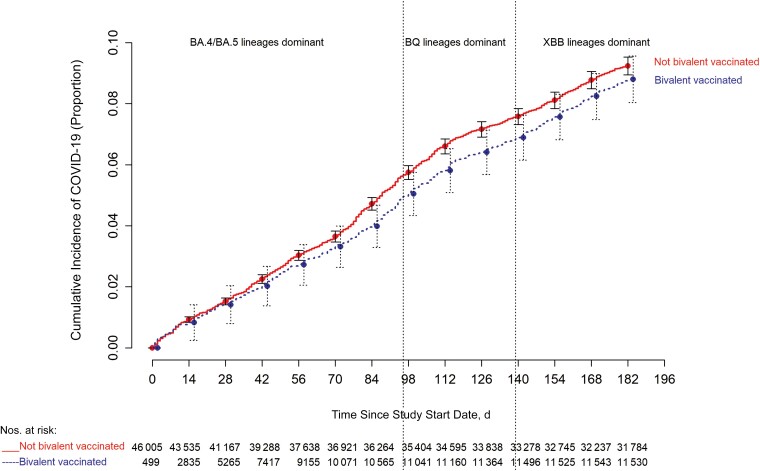
Figure 3.
Simon-Makuch plot comparing the cumulative incidence of coronavirus disease 2019 (COVID-19) for the bivalent-vaccinated and non–bivalent-vaccinated states. Day 0 was 12 September 2022, the date the bivalent vaccine was first offered to employees. Point estimates and 95% confidence intervals are jittered along the x-axis to improve visibility.

