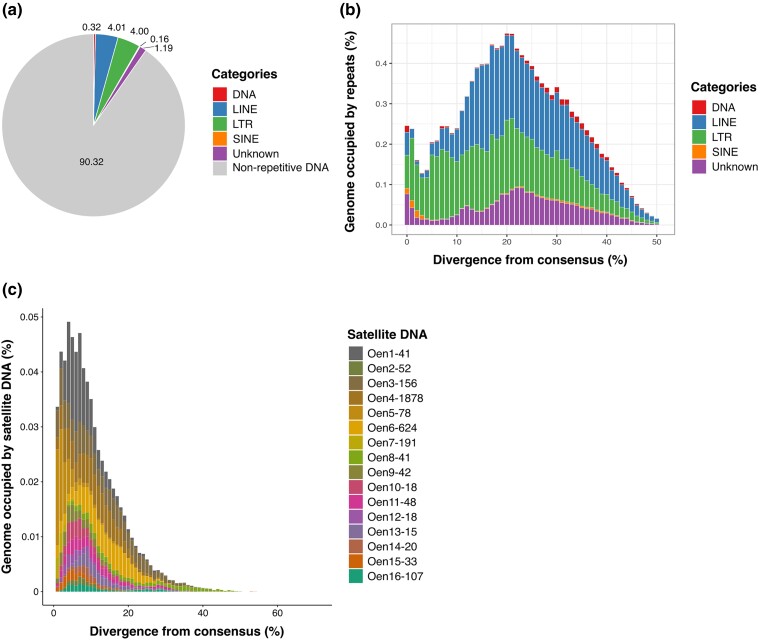
Fig. 3.
Repeat annotation landscapes. a) Pie chart summarizing the TE content annotated in the genome assembly. b) TE landscape. The divergence between interspersed repeat copies and their consensus sequences is shown on the X-axis as genetic distance calculated using the Kimura 2-parameter distance. The percentage of the genome assembly occupied by transposable elements is shown on the Y-axis. c) Satellite DNA landscape. The divergence between the satellite DNA consensus sequences and sequences annotated in the short-read library is shown on the X-axis as genetic distance calculated using the Kimura 2-parameter distance. The percentage of the genome (short reads) annotated as satellite DNA is shown on the Y-axis.

