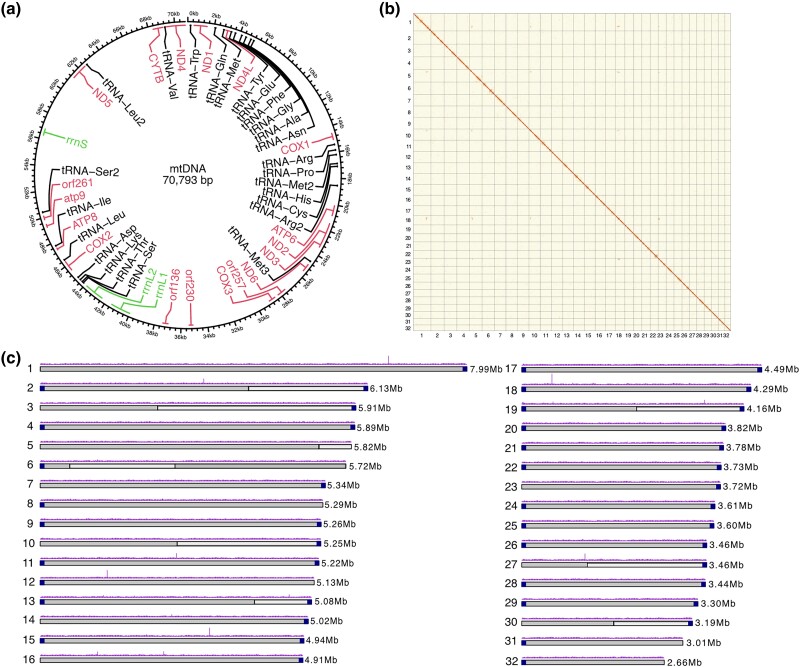
Fig. 2.
Nuclear and mitochondrial genome assemblies of Rhizophagus irregularis. a) Circular map of mitochondrial genome with annotated genes (pink), tRNAs (black), and rRNAs (green). b) Hi-C contact map visualized in PretextView. Chromosomes are displayed in size order from left to right (1–32). c) Physical map of 32 chromosomes numbered according to size (Mb). Grey coloring of the ideogram highlights contigs that were scaffolded together. Telomeric sequences are represented by dark blue squares at the ends of ideograms. Nanopore read coverage is shown as a purple histogram.

