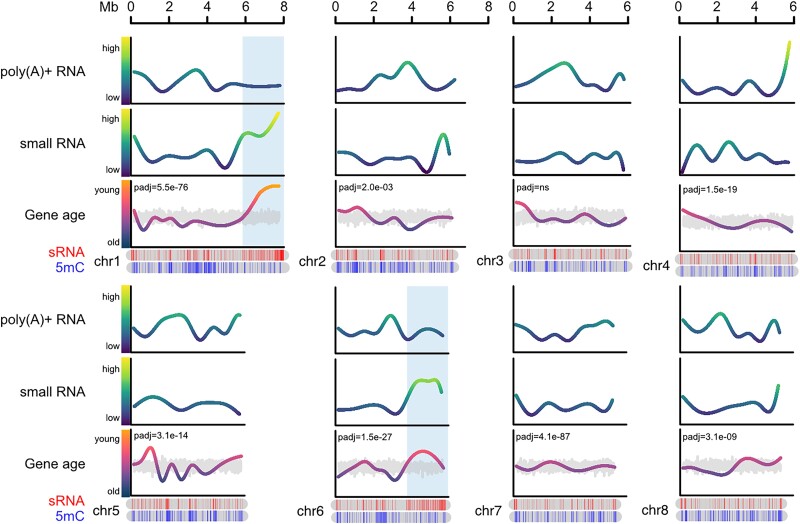
Fig. 6.
Genome-wide patterns of gene age and expression. Per-chromosome genomic distribution of Nanopore polyA+ RNA-Seq (top line graph, long RNA), expression of small non-coding RNAs (RPKM, second line graph, sRNA), gene age (third line graph, old to young corresponding to phyloranks 1 to 9), small RNA loci (top ideogram, sRNA), and highly methylated CGs (bottom ideogram, 5 mC values > 80% are shown, 5 mC). Color gradients of line graphs match the y-axis scales. Grey line graphs overlapping with gene ages represent the mean of 1,000 random permutations of gene ages, and a paired t-test (grouped by chromosome) was used to test the significance of observed gene age distributions relative to random permutations Padj). Values used for nonparametric linear regressions of long and small RNA expression are normalized RPKM calculated in 200 bp bins. Gene ages are regressed and plotted following chromosomal gene distribution (not binned). Blue-shaded regions highlight 2 loci containing the youngest genes and the highest concentration of highly expressed small RNA loci. The first 8 chromosomes are shown here, and chromosomes 9–32 are shown in Supplementary Fig. 4a.

