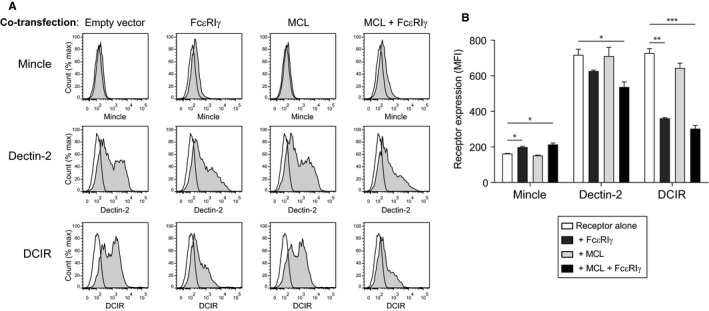
FIGURE 2.

Expression of Mincle, Dectin‐2 or DCIR on the surface of 293T cells. 293T cells were transfected with receptor alone, or co‐transfected with MCL, FcεRIγ or MCL and FcεRIγ. Data are displayed as histograms A, and summarized as geometric mean fluorescent intensity in B. Filled histograms show receptor‐specific staining, and open histograms show isotype control antibody binding. Data from one experiment are shown, representative of at least three independent experiments. Statistical significance was determined using one‐way ANOVA, with Dunnett correction for multiple comparisons.* P < .05, ** P < .01, *** P < .001
