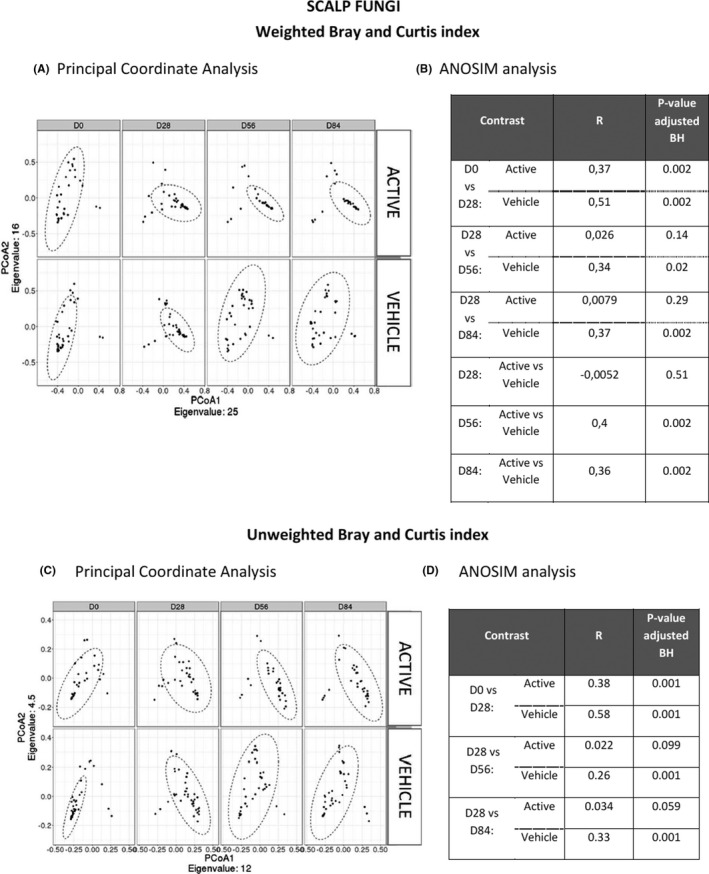
FIGURE 5.

Beta diversity using the Bray‐Curtis index. The variation of the Bray‐Curtis index (describing the variation of the beta diversity for the fungal species) is presented as PCoA (A,C), along with the comparison table between time points and groups using ANOSIM analysis (B,D). Two sets of indexes were investigated: Bray‐Curtis weighted and Bray‐Curtis unweighted indexes which give information focused on the relative abundance and species presence/absence respectively. BH: Benjamini‐Hochberg procedure was used for multiple comparisons adjustment
