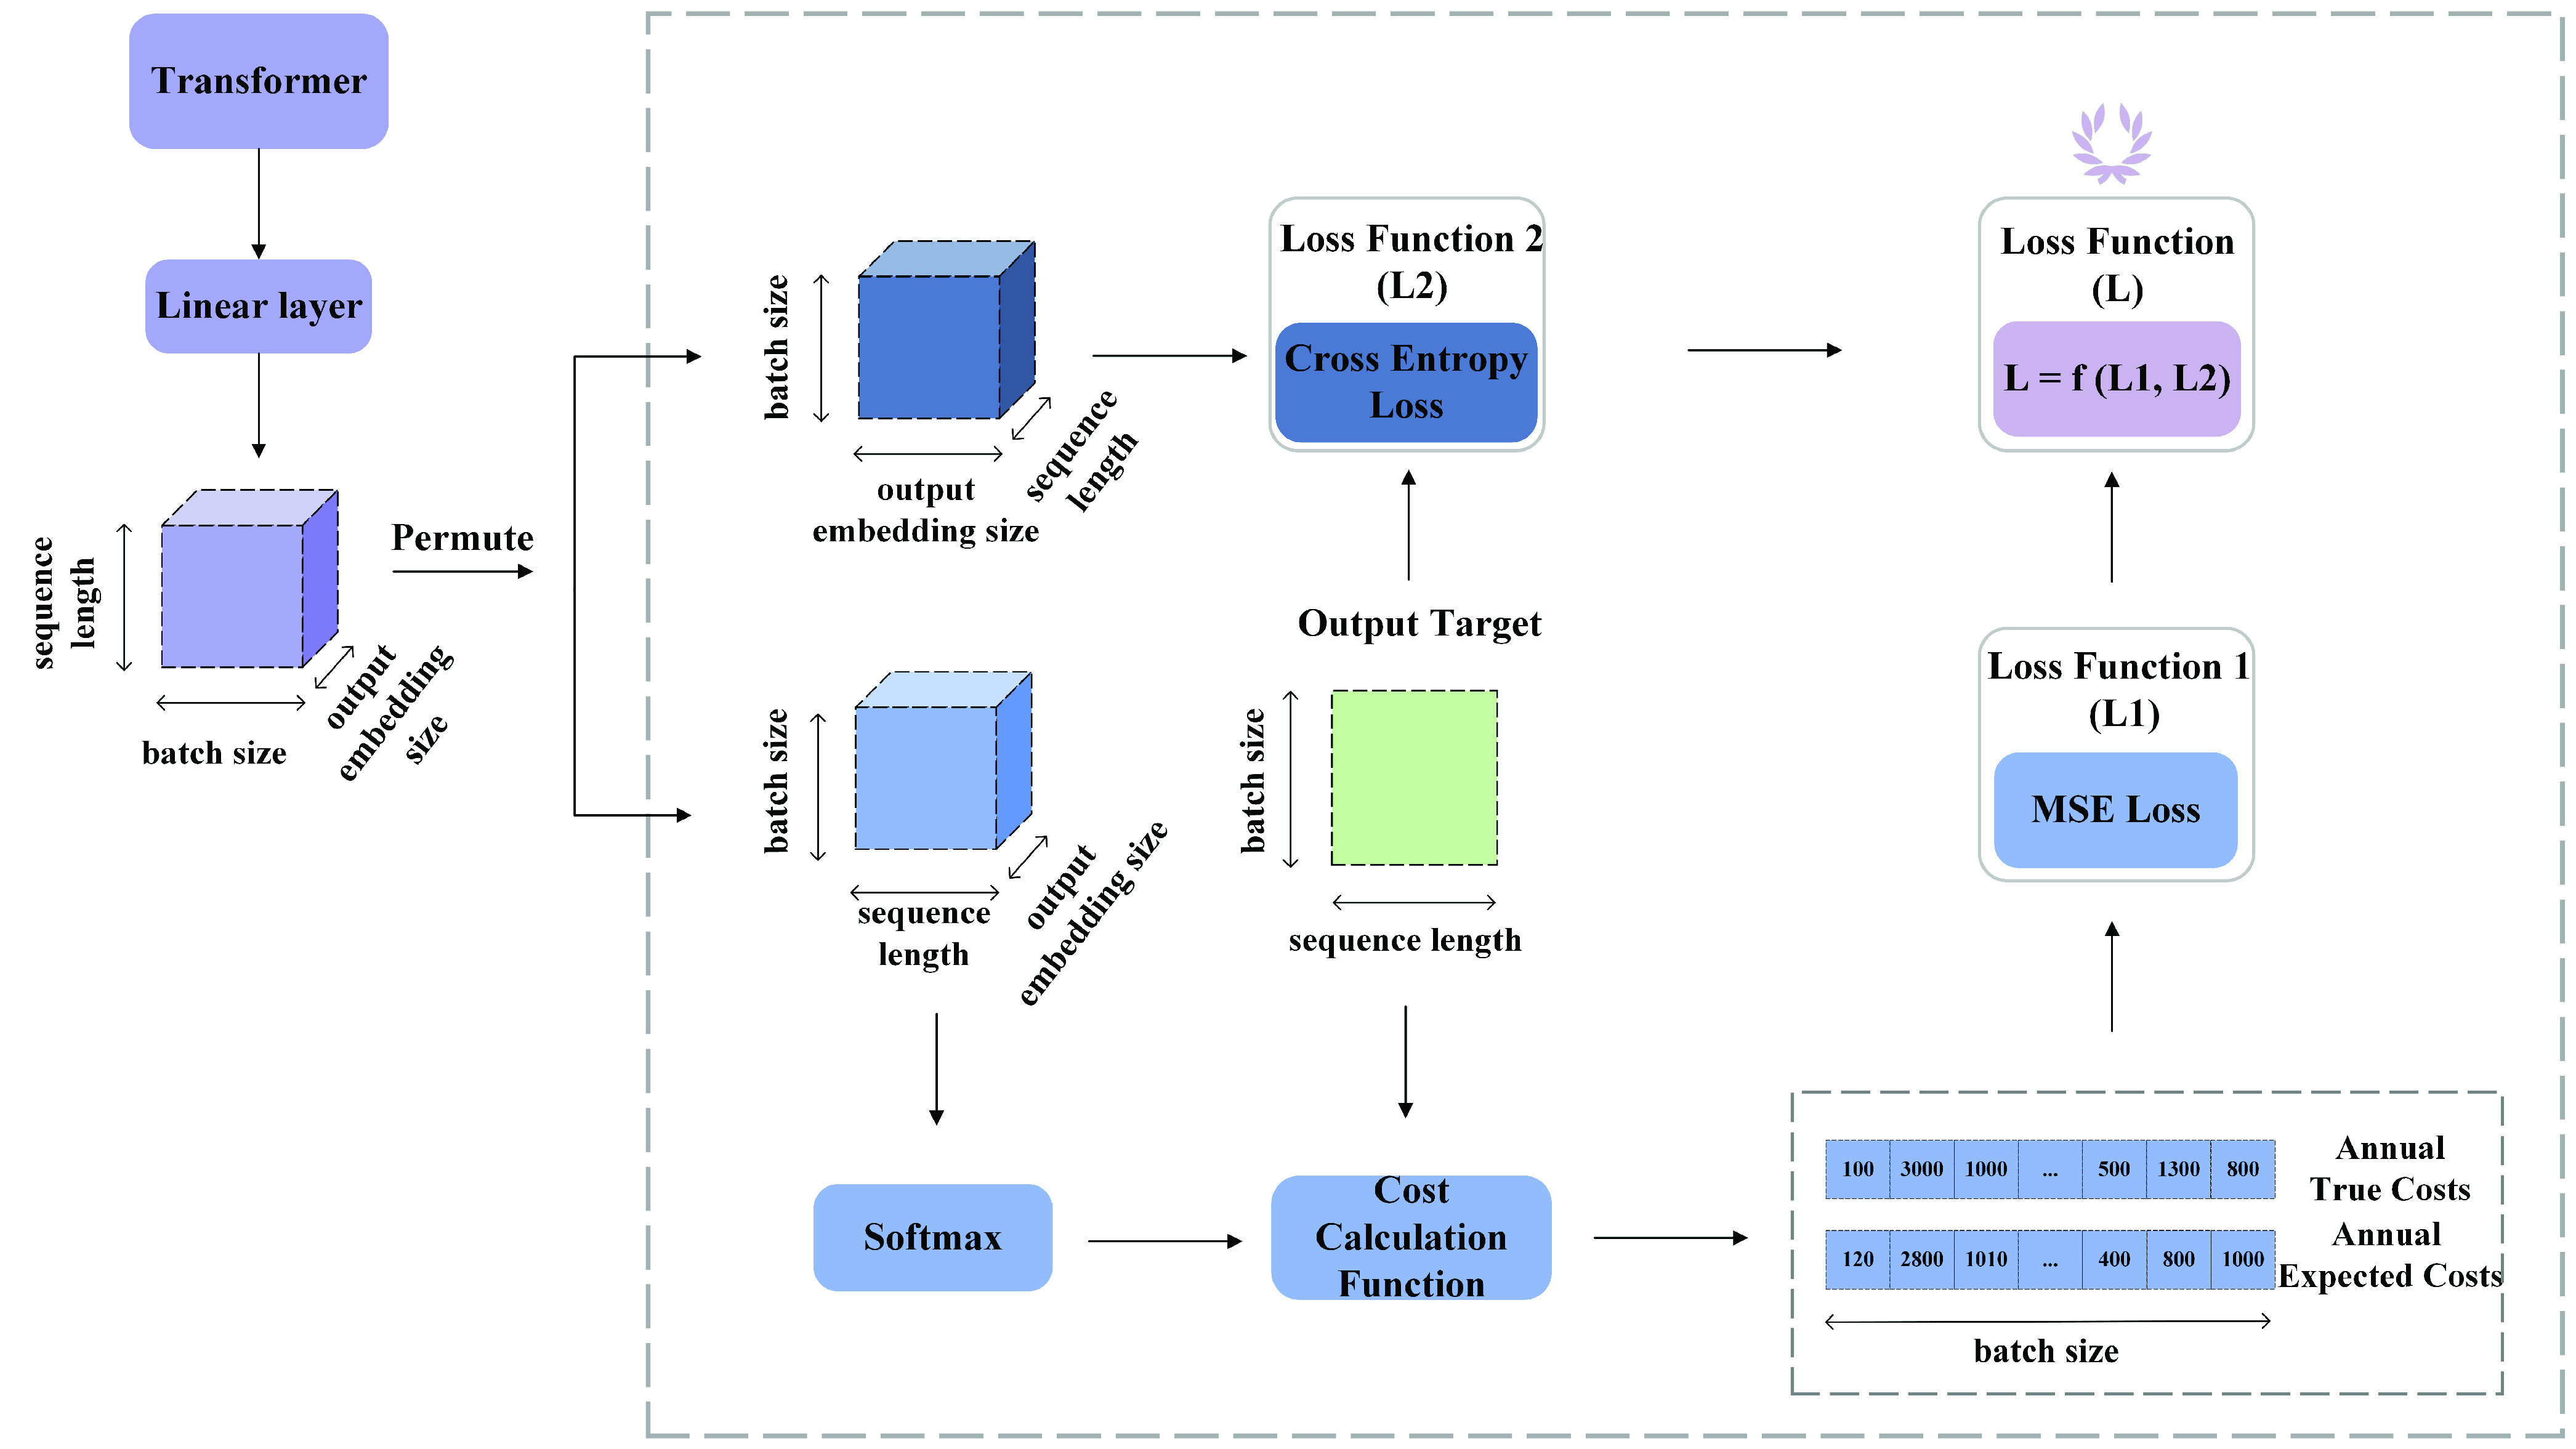
Fig. 6.

Loss function. To compute
 , we permute the dimension of the output of the linear layer, i.e., [sequence length, batch size, output embedding size], into [batch size, sequence length, output embedding size]. Then the output of the new dimension is passed to the Softmax layer to calculate the possibilities of the dimension of the output embedding size. Next, the cost calculation function helps calculate the labeled and predicted annual costs based on the output target and the Softmax output. The process is much simpler for calculating
 . The output of the linear layer is permuted into the dimension of [batch size, output embedding size, sequence length]. Then, the
 function from PyTorch takes the permuted output and the output target to calculate the cross-entropy loss. Finally, since there is a large difference in magnitude between
 and
and
 , we choose the common logarithm (log10) to scale down
 and then add it to
 , i.e.,
 .
.
