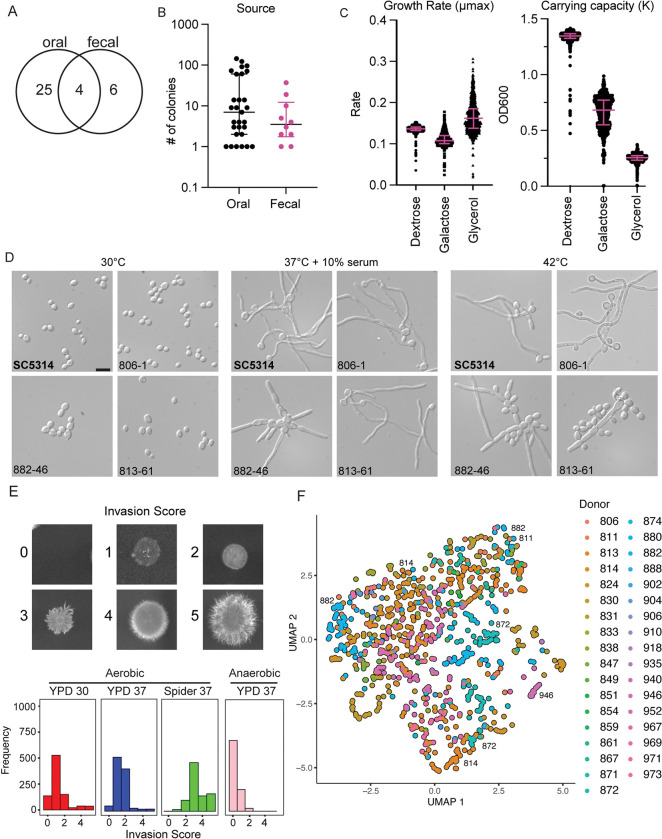
Fig 1. Characterization of isolates from healthy donors reveals extensive phenotypic heterogeneity.
(A) The number of healthy donors from whom C. albicans colonies were obtained by isolation site with 4 donors exhibiting both oral and fecal colonization. (B) Number of C. albicans colonies isolated per donor from each sample site. Error bars represent median and interquartile range in number of colonies from each positive individual donor. Significance determined by Wilcoxon rank sum test. (C) Strains varied in maximum growth rate and carrying capacity in response to different carbon sources. Growth curves were performed on each isolate under 3 carbon sources at 30°C for 24 h for dextrose and 48 h for glycerol and galactose in biological duplicate. Rate and carrying capacity were determined using the GrowthcurveR analysis package. Error bars represent median and interquartile range of the growth parameter. (D) All strains retained the capacity to filament in liquid inducing cues, but some demonstrated altered morphology and aggregation. Strains were incubated in the indicated conditions and imaged at 40× magnification. Scale = 10 μM. (E) Strains varied in their capacity to invade into solid agar. Colonies were incubated on the indicated conditions for 5 days before gentle washing and imaging for invasion. (F) UMAP plot for strain phenotypic similarity. All growth conditions and invasion phenotypes were nonlinearly projected into 2D space and colored by donor.

