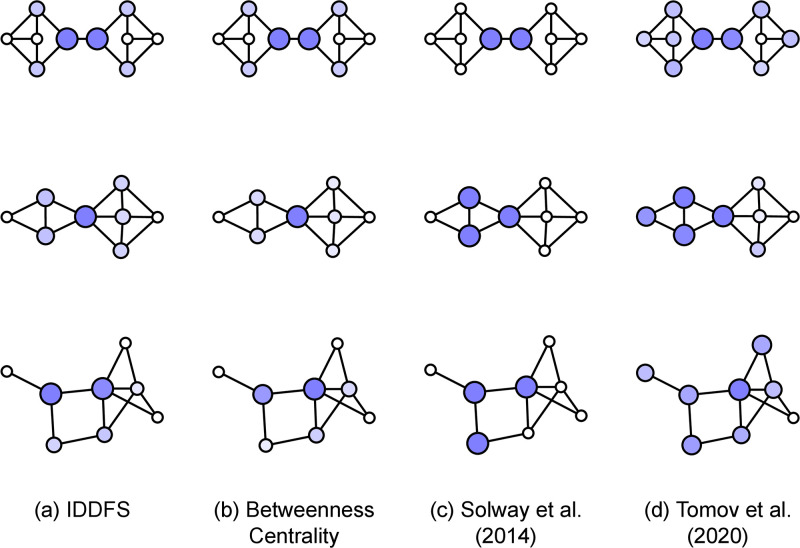
Fig 3. Comparing predictions of the (a) RRTD-IDDFS, (b) Betweenness Centrality, (c) Solway et al. (2014) [8], and (d) Tomov et al. (2020) [7] models.
State color and size is proportional to model prediction when using the state as a subgoal. (Top) The 10-node, regular graph from Solway et al. (2014) [8]. (Middle, Bottom) Two eight-node graphs selected from the 11,117 included in our analysis.

