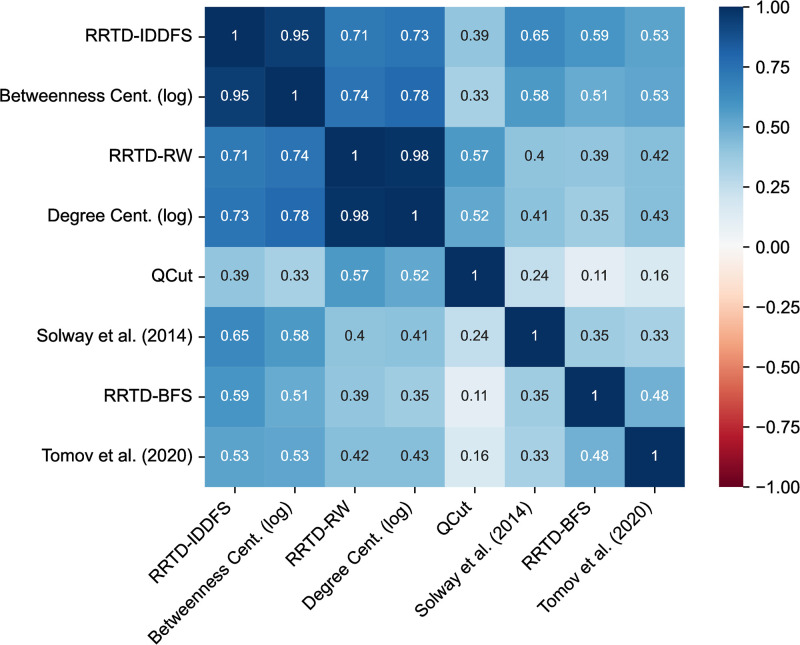
Fig 4. Correlation matrix comparing model predictions.
For each graph, correlations between two models are computed on the per-state subgoal values, then averaged across the 11,117 simple, connected, undirected, eight-node graphs. We discard correlations when either of the two models predicts a uniform distribution over subgoals because the correlation is not defined in those instances. References: Solway et al. (2014) [8], Tomov et al. (2020) [7].

