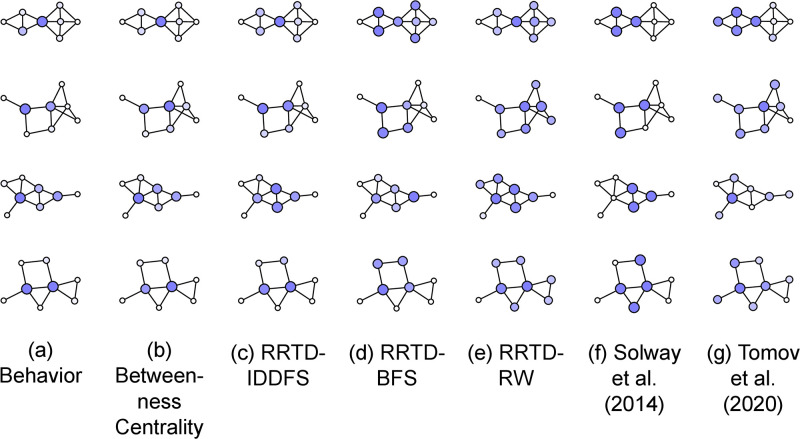
Fig 7. Visualization of behavior and model predictions on four eight-node graphs selected from the 30 graphs used for the experiment.
(a) State color and size is proportional to subgoal choice, summed across participants and probe types. Each participant responded to a total of 21 subgoal probes and the number of participants per graph, from the top graph to the bottom graph, was 28, 26, 25, and 26. Visualized models are (b) RRTD-IDDFS, (c) RRTD-BFS, (d) RRTD-RW, (e) Betweenness Centrality, (f) Solway et al. (2014) [8], and (g) Tomov et al. (2020) [7]. For model predictions, state color and size is proportional to model prediction when using the state as a subgoal.

