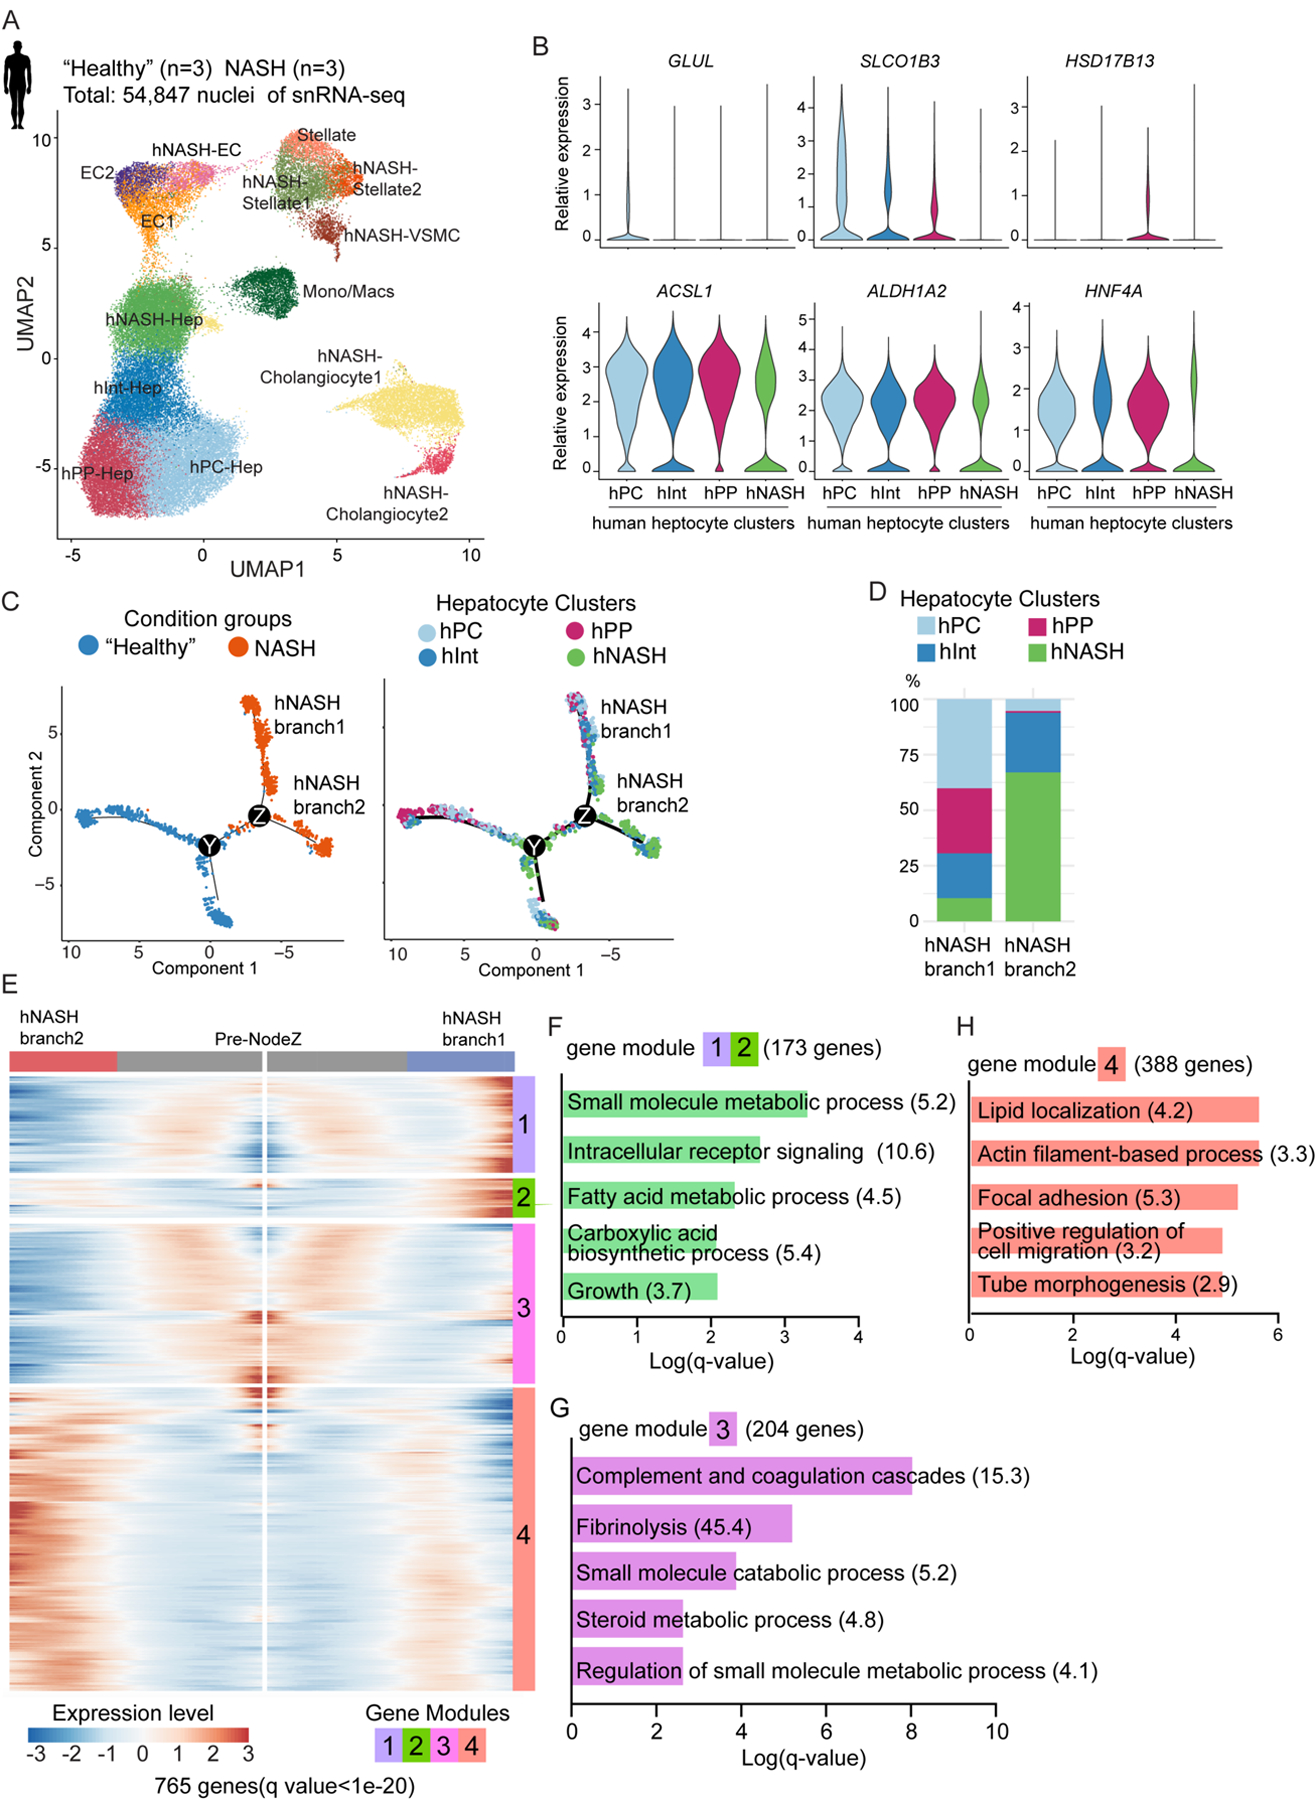
Fig. 2. snRNA-seq uncovers bifurcation of hepatocyte trajectory in human patients with NASH.

(A) UMAP plot visualization of the unsupervised cell clusters containing 54,847 nuclei from livers of “healthy” and NASH human livers. Hep: hepatocytes; Mono/Mac: monocytes/macrophages; EC: endothelial cells; VSMC: vascular smooth muscle cells.
(B) Violin plot shown differential gene expression across 4 hepatocyte clusters.
(C) Pseudotime analysis by Monocle2 reveals hepatocyte trajectory bifurcation during NASH progression. From left to right, the color code indicates the condition groups and hepatocyte clusters.
(D) The composition of hepatocyte clusters in hNASH branch1 and hNASH branch2.
(E) Heatmap of the 765 genes (q value < 1e-20) that determined hepatocyte trajectory bifurcation at NodeZ in Fig. 2C using branched expression analysis modeling (BEAM) in Monocle2. These genes are clustered into 4 different modules based on their gene expression pattern across Monocle2 pseudotime.
(F-H) GO analysis of gene modules which determined hNASH branch1 and 2 (Odds ratio indicated after each term).
