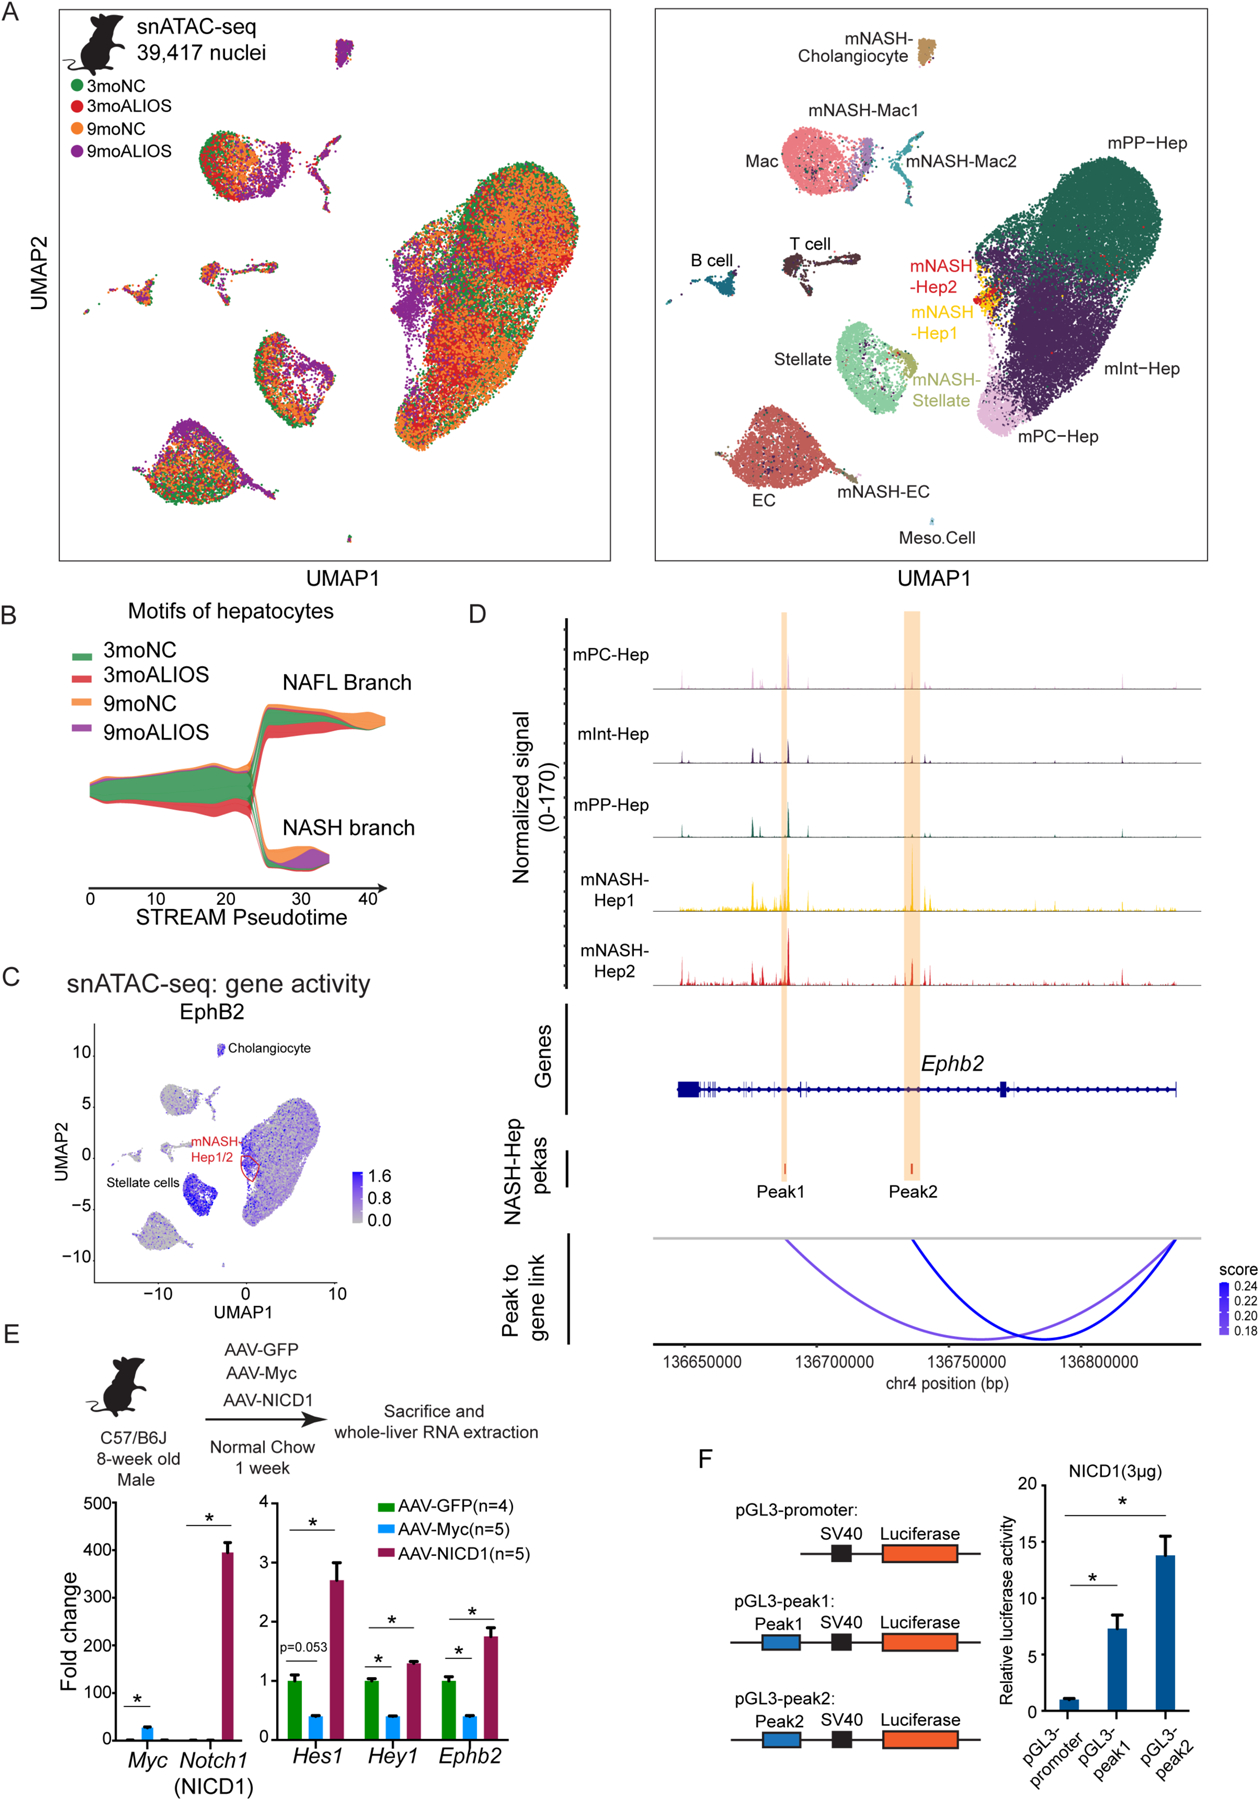
Fig. 4. Notch induces EphB2 expression in hepatocytes.

(A) Left: UMAP plot of snATAC-seq of mouse livers colored by sample identity. Right: UMAP plot of snATAC-seq colored by clusters (Hep: hepatocytes; EC: endothelial cells; MAC: macrophages).
(B) Using ChromVAR motif-cell z-score matrix as input, STREAM pesudotime density plot uncovered a bifurcation of hepatocyte TF motif trajectory during NASH progression. NAFL branch and NASH branch were assigned based on the experimental group composition in the corresponding branch.
(C) UMAP plot of snATAC-seq demonstrated that mNASH Hep1/2 acquired elevated gene activity of EphB2 (orange circle).
(D) snATAC-seq peak tracks across different hepatocyte clusters at Ephb2 locus. Peak to gene links were calculated based on the correlations between peak accessibility in snATAC-seq and gene expression in snRNA-seq. Two cis-elements (regions highlighted in yellow as Peak1 and Peak2) were predicted to positively control Ephb2 expression in hepatocytes.
(E) Top: experimental scheme of forced activation of NICD and Myc in hepatocytes. Bottom: NICD but not Myc in hepatocytes up-regulated Ephb2 expression. Data are expressed as mean ± SEM, *p<0.05, Mann-Whitney U test.
(F) NICD promoted luciferase activity through the two cis-regulatory elements at Ephb2 locus identified by the integration of snRNA-seq and snATAC-seq. Data are expressed as mean ± SD, n=3 in each group, * p<0.05 Mann-Whitney U test.
