. 2023 Jun 1;12:e76927. doi: 10.7554/eLife.76927

Figure 5. DDX39B depletion triggers the retention of FOXP3 introns.

(A) RNAseq reads mapping to the FOXP3 genomic region in control (NTC) or DDX39B depleted (Sh3) CD4+ T cells from Donors 1 and 4. Read counts for FOXP3 introns 6, 7, and 9 are shown on the Y-axis in the two insets. (B, C) Abundance of FOXP3 RNA introns relative to total FOXP3 RNA after DDX39B depletion in CD4+ T cells from six donors (B) or MT-2 cells (C). (D–E) Rescue of the DDX39B depletion (Sh3) by exogenous expression (GFP or DDX39B) in MT-2 cells. The abundance of FOXP3 and DDX39B relative to Tubulin (D) or FOXP3 RNA introns relative to total FOXP3 RNA (E) are shown.*: p<0.05, **: p<0.01, ***: p<0.001 and ****: p<0.0001.
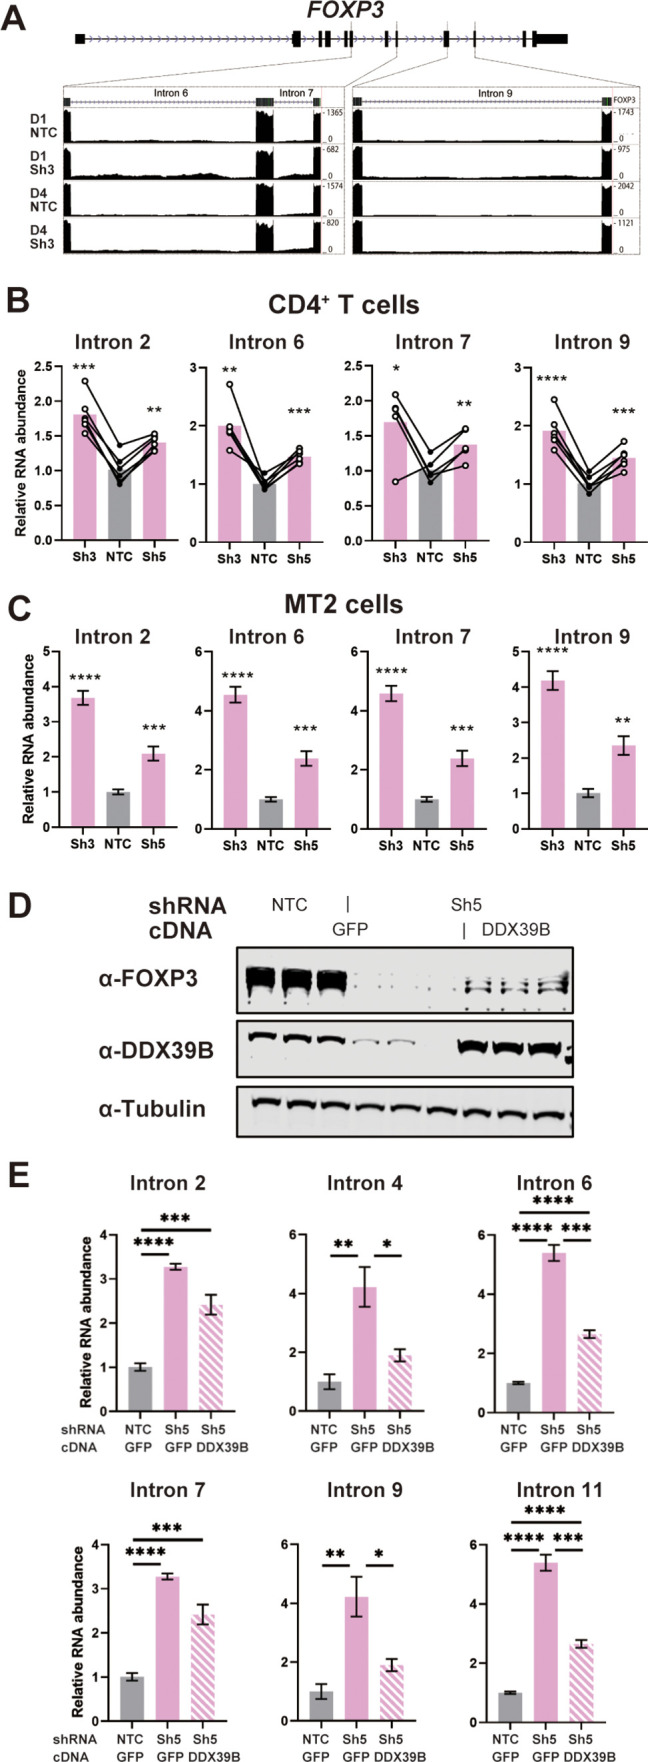
Figure 5—source data 1. Two versions of source data files have been uploaded for all gels/blots shown in this figure: (1) the original files of the full raw unedited gels or blots and; (2) figures with the uncropped gels or blots with the relevant bands clearly labeled.

Figure 5.

Figure 5—figure supplement 1. Quantification of FOXP3 retained introns in the chromatin fraction of MT-2 cells.

Figure 5—figure supplement 1.

Control (NTC) or DDX39B-depleted (Sh3 or Sh5) MT-2 cells were fractionated into cytoplasm, nucleoplasm and chromatin fractions. Retained FOXP3 introns were quantified in the chromatin compartment by RT-qPCR using intron-specific primers and normalized to total FOXP3 RNA. **: p<0.01, ***: p<0.001.
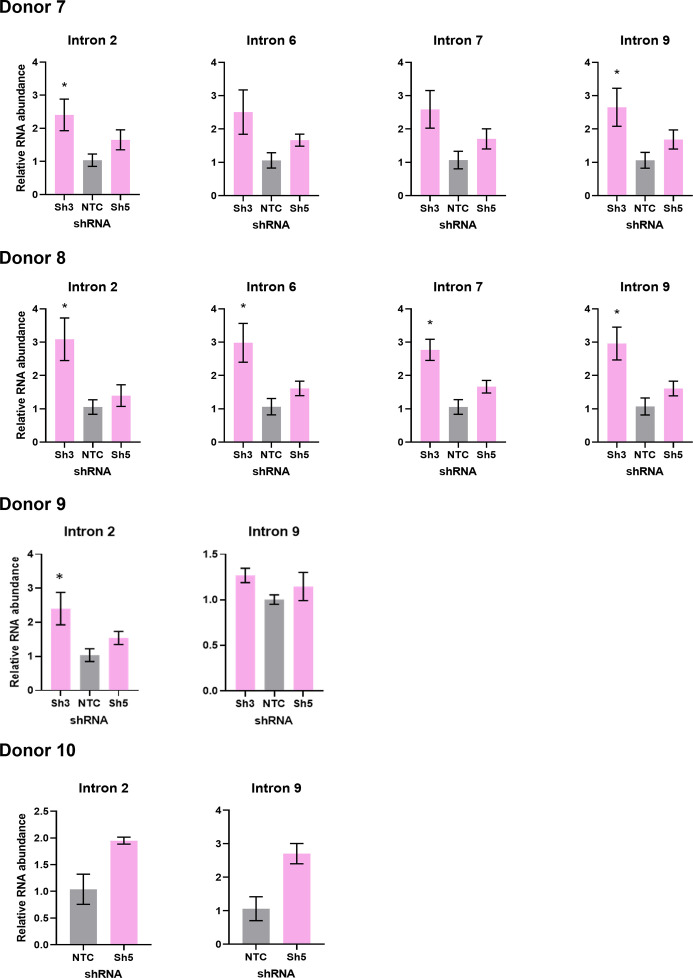
Figure 5—figure supplement 2. Quantification of FOXP3 retained introns in primary and induced Tregs.

Figure 5—figure supplement 2.

DDX39B was depleted in Tregs from four independent donors (Donors 7–10) via lentivirus transduction with either control (NTC) or DDX39B targeting (Sh3 or Sh5) shRNAs. Retained FOXP3 introns were quantified from total RNA by RT-qPCR using intron-specific primers and normalized to total FOXP3 RNA. *: p<0.05.
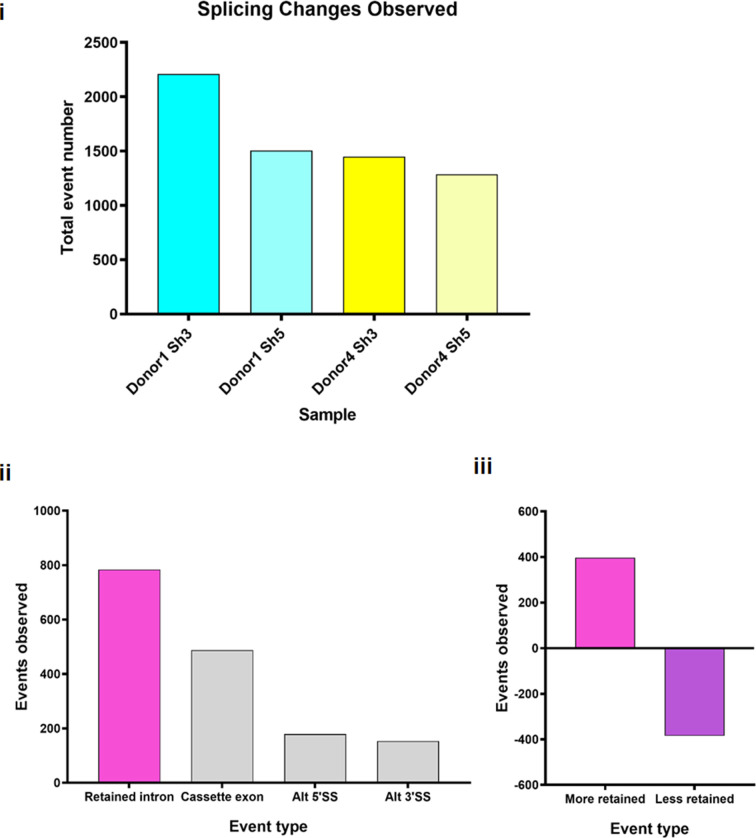
Figure 5—figure supplement 3. Alternative splicing events observed upon DDX39B depletion in CD4+ T cells.

Figure 5—figure supplement 3.

Splicing analysis of RNAseq data was carried out using Vast-Tools. (i) Total events changed between control and either of two knockdown conditions (Sh3 and Sh5) in two donors (donors 1 and 4). (ii) Type of events of Sh3 knockdown in either donor are shown. Alt 5’SS, alternative 5’ splice site; Alt 3’SS, alternative 3’ splice site. (iii) Intron retention events in either donor are divided into those showing more retention or less retention with DDX39B knockdown.