. 2023 Jun 1;12:e76927. doi: 10.7554/eLife.76927

Figure 7. C-rich py tracts in FOXP3 introns determine DDX39B sensitivity.

(A) Schematic diagram of the splicing reporter. (B) Relative splicing efficiency of the wild-type (WT) or mutant (5’ SS mutant and Poly-U mutant) FOXP3 intron 11 splicing reporters after DDX39B depletion with D11 and D13 siRNAs. The sequence of 5’ splice sites (5’ SS) for these introns is shown indicating the three upstream exonic residues in capital letters and the six downstream intronic residues in minuscule letters. The sequence of the py tracts and 3’ splice sites (3’ SS) for these introns is shown indicating the intronic residues in minuscule letters and a single exonic residue in capital letters. (C) Nucleotide frequency in the py tract of introns that are insensitive (unaffected) or sensitive (retained) to DDX39B depletion. *: p<0.05, **: p<0.01, ***: p<0.001 and ****: p<0.0001.
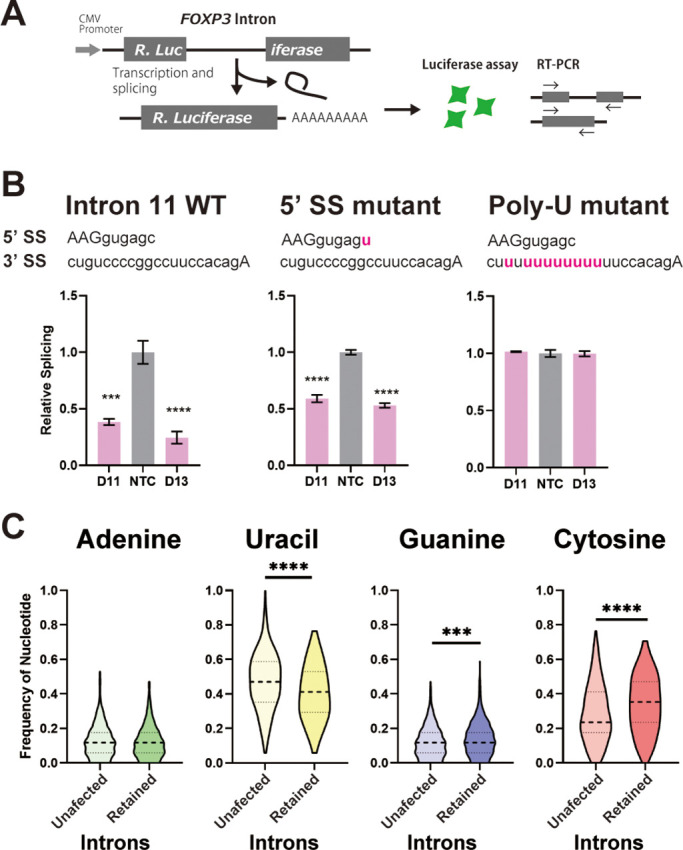
Figure 7.

Figure 7—figure supplement 1. Luciferase activity of the splicing reporters.

Figure 7—figure supplement 1.

Control (NTC) or DDX39B-depleted (D11 or D13 siRNAs) HeLa cells were co-transfected with a Firefly luciferase reporter (transfection control, FLuc) and Renilla luciferase (RLuc) splicing reporters with no intron, human ßglobin (HGB1) intron 2, or FOXP3 introns 7, 9, or 11. Relative splicing efficiency of reporters was inferred by measuring luciferase activity (RLuc/FLuc) normalized to NTC. *: p<0.05, **: p<0.01, ***: p<0.001 and ****: p<0.0001.
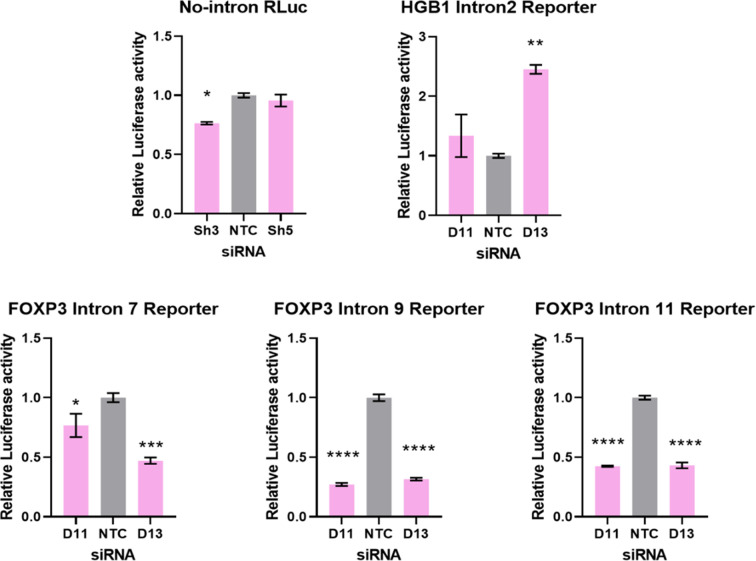
Figure 7—figure supplement 2. RT-PCR analysis of splicing efficiency of wild-type or mutant FOXP3 Intron 11 RLuc reporters.

Figure 7—figure supplement 2.

Control (NTC) or DDX39B-depleted (D11 or D13) HeLa cells were transfected with FOXP3 intron 11 RLuc reporters (WT, 5’ SS consensus or 3’ Poly-U mutant), and splicing efficiency was directly measured by endpoint RT-PCR. Quantification of the gels is shown in Figure 7B.
Figure 7—figure supplement 2—source data 1. Two versions of source data files have been uploaded for all gels/blots shown in this figure: (1) the original files of the full raw unedited gels or blots and; (2) figures with the uncropped gels or blots with the relevant bands clearly labeled.
Figure 7—figure supplement 3. RT-PCR analysis of splicing efficiency of wild-type or mutant FOXP3 Intron 7 RLuc reporters.

Figure 7—figure supplement 3.

Control (NTC) or DDX39B-depleted (D11 or D13) HeLa cells were transfected with FOXP3 intron 7 RLuc reporters (WT, 5’ SS consensus or 3’ Poly-U mutant), and splicing efficiency was directly measured by endpoint RT-PCR. Quantification is shown on the right for the lower two panels; given the very low level of splicing with intron 7 WT reporter it could not be accurately quantified. ***: p<0.001 and ****: p<0.0001.
Figure 7—figure supplement 3—source data 1. Two versions of source data files have been uploaded for all gels/blots shown in this figure: (1) the original files of the full raw unedited gels or blots and; (2) figures with the uncropped gels or blots with the relevant bands clearly labeled.
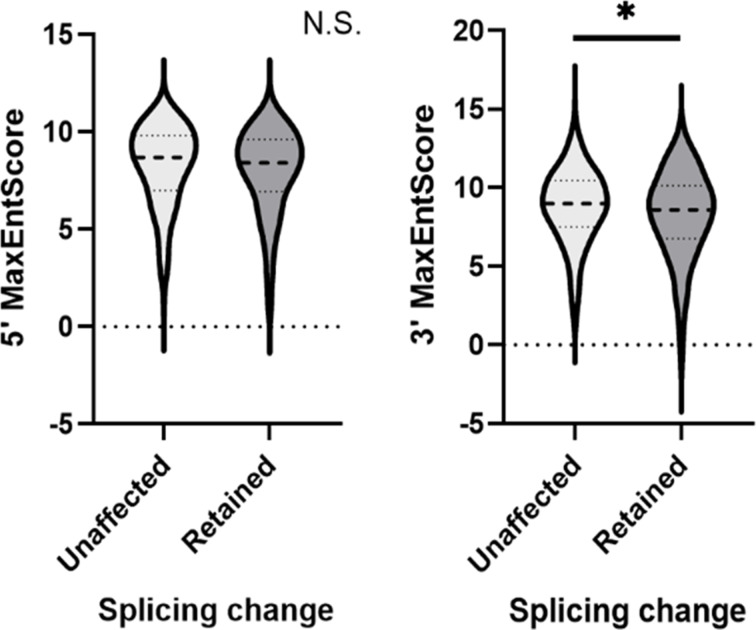
Figure 7—figure supplement 4. Comparison of Max entropy splice sites (SS) score between unaffected and DDX39B-sensitive introns.

Figure 7—figure supplement 4.

Max entropy score of 5’ SS and 3’ SS of unaffected (500 randomly selected) and introns with increased retention upon DDX39B depletion (397 events) was determined using MaxEntScan (Yeo G and Burge CB, 2004). Dashed lines within the violin plots denote median values. *: p<0.05.
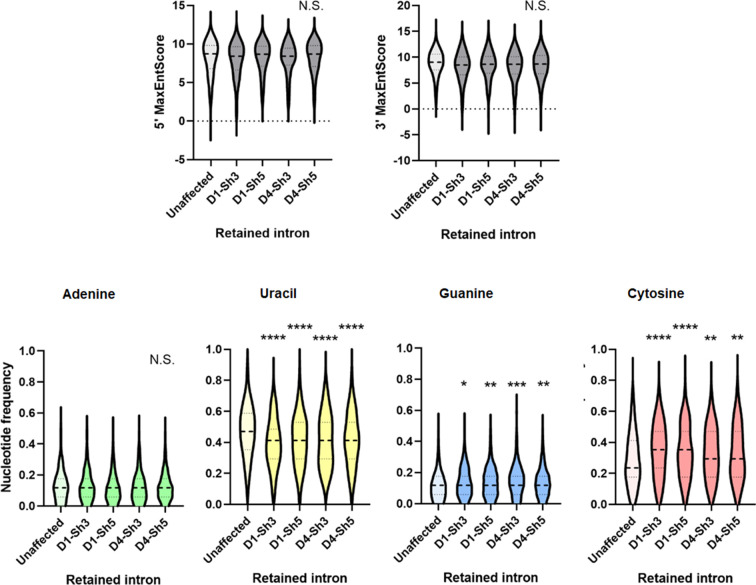
Figure 7—figure supplement 5. Comparison of Max entropy splice site (SS) scores (top panel) and nucleotide composition of py tracts (bottom panel) of unaffected introns or introns that were more retained in CD4+ T cells from either donor 1 or 4 depleted of DDX39B by treatment with Sh3 or Sh5.

Figure 7—figure supplement 5.

*: p<0.05, **: p<0.01, ***: p<0.001 and ****: p<0.0001.
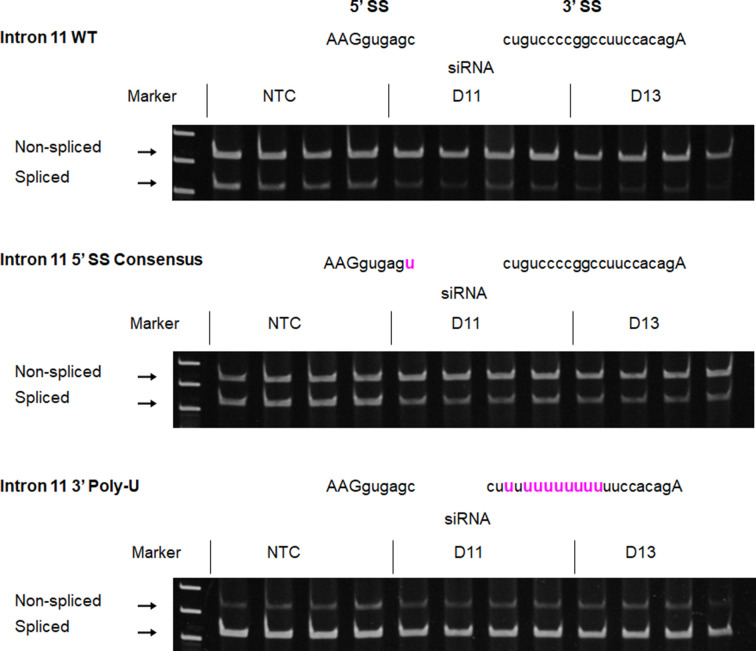
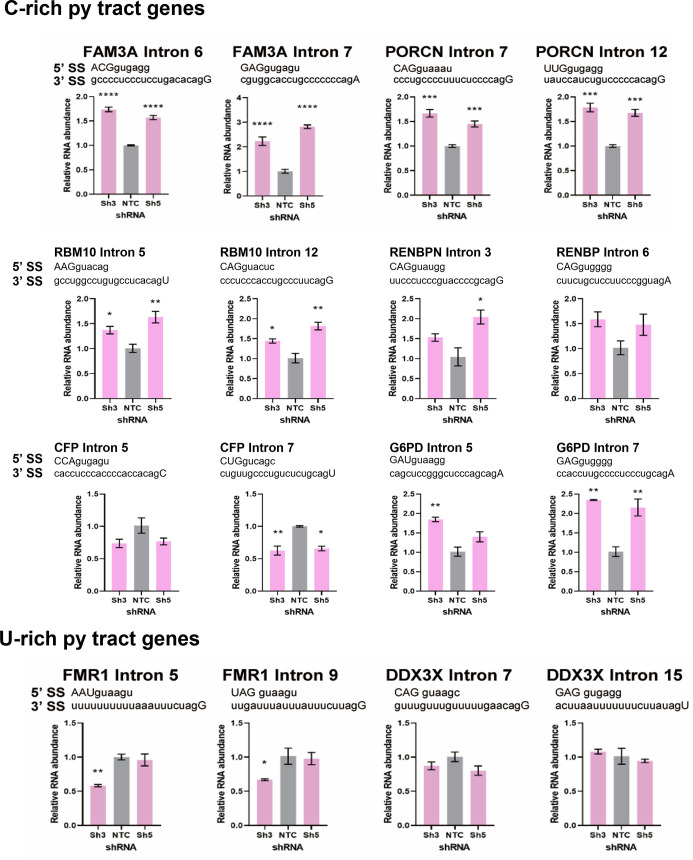
Figure 7—figure supplement 6. Detection of intron retention events in X chromosome genes with C-rich or U-rich py tracts.

Figure 7—figure supplement 6.

Introns of the transcripts with C-rich (top) or U-rich (bottom) py tract were quantified by intron-specific RT-qPCR in control (NTC) and DDX39B-depleted (Sh3 or Sh5) MT-2 cells and normalized to their corresponding total transcripts. *: p<0.05, **: p<0.01, ***: p<0.001 and ****: p<0.0001.
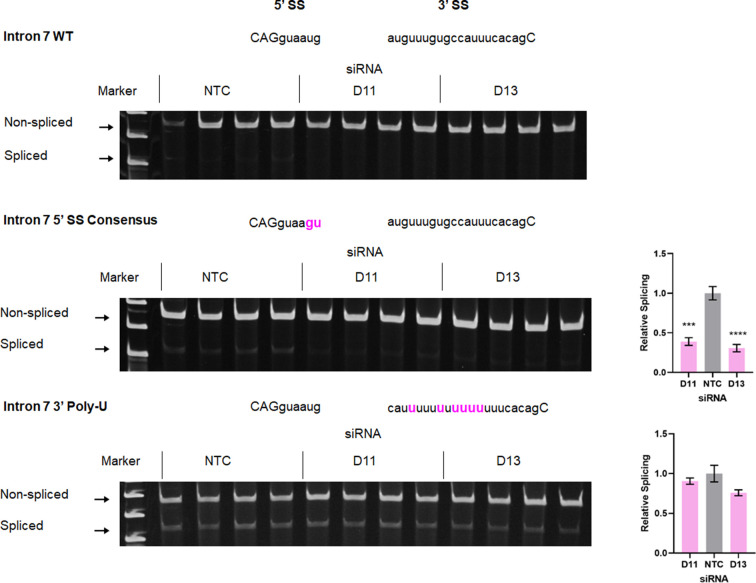
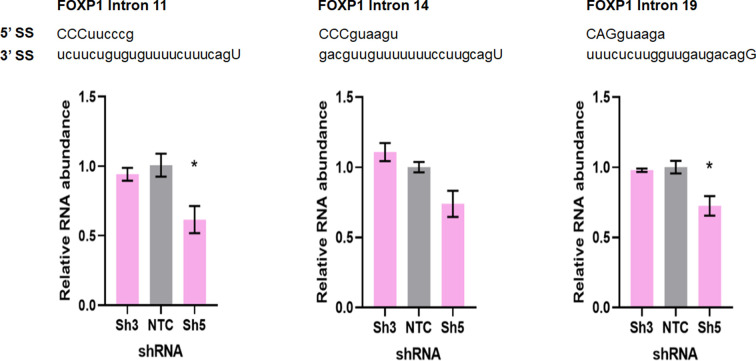
Figure 7—figure supplement 7. Retention of FOXP1 introns is not increased upon DDX39B depletion in MT-2 cells.

Figure 7—figure supplement 7.

FOXP1 transcripts including introns 11, 14, or 19 were quantified by intron-specific RT-qPCR in control (NTC) and DDX39B-depleted (Sh3 or Sh5) MT-2 cells and normalized to total FOXP1 transcripts. *: p<0.05.
Figure 7—figure supplement 8. RT-PCR analysis of splicing efficiency of wild-type or mutant FOXP1 Intron 19 RLuc reporters.

Figure 7—figure supplement 8.

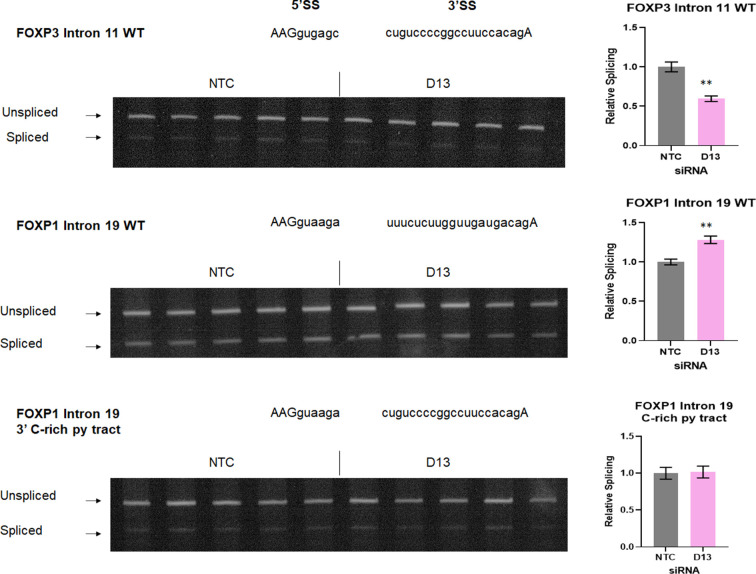
Control (NTC) or DDX39B-depleted (D13) HeLa cells were transfected with FOXP3 or FOXP1 RLuc reporters. Splicing efficiency was directly measured by endpoint RT-PCR. Quantification is shown on the right. **: p<0.01.
Figure 7—figure supplement 8—source data 1. Two versions of source data files have been uploaded for all gels/blots shown in this figure: (1) the original files of the full raw unedited gels or blots and; (2) figures with the uncropped gels or blots with the relevant bands clearly labeled.
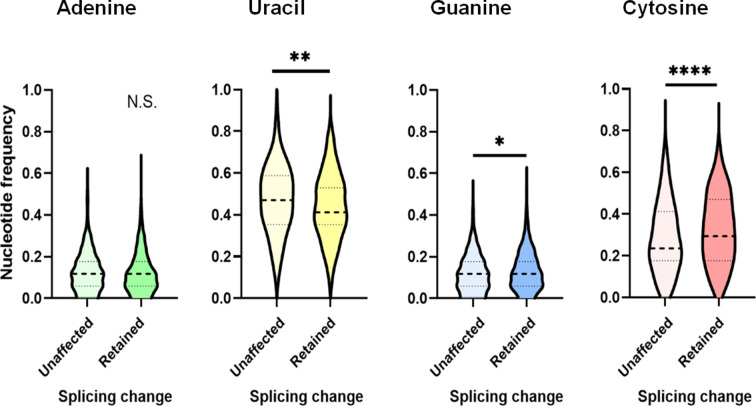
Figure 7—figure supplement 9. Comparison of py tract composition between unaffected and less-retained introns.

Figure 7—figure supplement 9.

Nucleotide frequency of py tracts of unaffected (500 randomly selected) and those that are less-retained upon DDX39B knockdown (387) was calculated. Dashed lines denote median values. p<0.05, **: p<0.01, ***: p<0.001 and ****: p<0.0001.